STEPS in BUSINESS EXCELLENCE (SBEXC)
Volume 2, Issue 1, pp: 9-18
![]()
The Effect of Intellectual Capital on the Asymmetric Behaviour of Costs
A Case Study of Industrial Companies in Egypt
Hanadi Nabil Othman 1,a*, Iyad Malik Hatem 1,b
1Department of Accounting, Faculty of Economics, Tishreen University, Syria.
E-mail: hanadi.othman@tishreen.edu.sy a,*, iyad.malek.hatem@tishreen.edu.sy b
* Correspondence Author
Received: 11 January 2024 | Revised: 23 March 2024 | Accepted: 12 May 2024 | Published: 16 July 2024
The objective of this research is to ascertain the naturae of the behaviour exhibited by marketing, administrative and general costs in industrial companies listed on the Egyptian financial market. Furthermore, the effect of intellectual capital comprising human capital, structural capital, employed capital on the asymmetric behaviour of costs Marketing, Administrative, and General will be tasted.
The research sample consisted of 23 industrial companies for the period 2018-2022, Secondary quantitative data was collected from the financial statements and annual reports published on the websites of the studied companies, this data was then analysed using Eviews 10 and SPSS.V.25.
The research demonstrated that selling, administrative, and general costs exhibit an asymmetric sticky behavior. Furthermore, the inverse effect of human capital, structural capital and employed capital on the asymmetric behaviour of costs (SA&G) was identified, indicating Egyptian companies management does not have a relatively long-term performance horizon with regard to the development of intangible assets Consequently, these companies tend to view selling, administrative and general costs as an expense leading to a reduction or elimination of these expenses when sales volume decreases resulting in lower commitment.
Keywords: Asymmetric Behaviour, Intellectual Capital, Human Capital, Structural Capital, Employed Capital
The modern business environment is characterised by technological and economic developments that have led to an intensification of competition between companies This has highlighted the necessity for management to utilise cost accounting system information in order to assist them in the formulation of appropriate policies and the making of rational decisions (Qahtan, 2021), In order to fulfil this role, management to be knowledgeable. Good cost behaviour represents a key instrument of strategic management enabling the identification and management of untapped resource capacity, the planning and control of costs, and the implementation of the company’s strategy (Ibrahim, 2015). A survey report conducted by Deloitte (2016) involving 210 senior executives of Fortune 1000 companies based in the United States of America, revealed that a lack of comprehension of cost behaviour represents a significant impediment to effective cost management. This can be attributed to rapid advancement of technology and the challenges posed by economic fluctuations. Dynamism and globalization that may have a direct impact on cost management strategies.
Costs are traditionally classified according to their relationship to the volume of activity, into fixed, variable and mixed costs. It is assumed that the total fixed costs are independent of the change in the volume of activity within the appropriate range of available energy and in the short term. In contrast, the total variable costs are linked to a proportional linear relationship with the change in the volume of activity, regardless of the direction of this change, whether increasing or decreasing compared to the level of activity in the previous period. This implies that there is uniformity in cost behaviour when the volume of activity changes. With regard to mixed costs, these are costs that combine the characteristics of both fixed and variable costs, thus including both a fixed and a variable part (Anderson et al, 2003; Hussien et al., 2021; Yang & Chen, 2023).
However several studies such as: Anderson et al (2003); Weiss (2010), Yung (2019), El-Sayed & El-Tantawy (2021), Khayri (2021), Hussain et al., (2021); Abdul Watab (2021), demonstrated that certain types of costs exhibit asymmetric responses to changes in activity volume . This phenomenon, known as asymmetric cost behaviour which may be sticky or anti-sticky behaviour. This opened the door for research into the determinants that could explain the asymmetric behaviour, with intellectual capital which plays a major role in the success of companies (Yang, 2019; Badie et al., 2023), the size of intangible assets is one of the factors influencing management decisions related to retaining untapped resources when the volume of activity decreased, companies with high intellectual capital were found to have structural and organizational designs, a human workforce, and a large market share that provide them with stable competitive advantages. Consequently, it was hypothesized that the managers of these companies do not agree to reduce investments in intangible assets, especially intellectual capital, upon a temporary decrease in sales volume, which makes the behaviour of these costs more sticky (Nikbakht & Pourbagherian, 2022).
The Egyptian economy was confronted with a number of challenges that impeded the possibility of attaining sustainable development in general and sustainable industrial development in particular. This was due to the fact that the Egyptian industry’s excessive reliance on production requirements imported from abroad, which causes an increase in costs. However, the global spread of the Covid 19 virus, this led to a significant slowdown in the industrial sector due to the disruption of industrial operations. The closure and precautionary measures as a result of the disruption of global supply chains, which caused instability in the trend of demand during that period, creating a suitable climate for the emergence of asymmetric cost behaviour as a result of unstable changes in the volume of demand (Shalabi Ali, 2020), so the current research aims to test the effect of capital Intellectual research with its three components (Human capital, Structural capital, Employed capital) on the asymmetric behaviour of the marketing, administrative and general costs of industrial companies listed on the Egyptian financial market for the period 2018-2022. This due to the lack of previous Arab studies that have addressed this impact in the Arab environment, and the prevalence of asymmetric behaviour within the industrial sector in Egypt and across multiple items of costs, which may help to narrow the research gap.
The paper is structured as follows: First, a review of the relevant literature is presented. Second, a theoretical background is provided to explain the phenomenon of asymmetric cost behaviour and intellectual capital, Third, the research methodology and experimental results are defined to test the hypotheses, Fourth, the conclusions and summary of the research are reviewed, and recommendations are presented in light of the results. Introduction. Finally, the limitations of the research are elucidated and suggestions for future research are presented.
Based on traditional expense behaviour theories, expense changes are solely dependent on activity level alteration and these changes are symmetrical. This approach posits that, variable expenses change in accordance with alterations of the activity driver. In contrast, the theoryof expenses stickiness challenges this assertion, proposing that the rate of expense reduction in periods of decreased activity, is lower than the rate of expenses increase in periods of increased activity. This is the result of commitments by management to consume resources.
The results of previous studies differed in the effect of the intellectual capital with its three components on asymmetric cost behaviour. The study by Venieris et al., (2015) examined a sample of 1,799 listed companies in the United States of America over the period from 1979-2009, The findings indicated that companies with high (low) levels of structural capital exhibited a sticky (anti-sticky) behaviour in their marketing, administrative, and general costs. High levels of structural capital form more optimistic expectations, as they maintain marketing and administrative costs due to the company’s economic logic, which aims to increase marketing, administrative, and general costs for developing intellectual capital.
Nevertheless, this increase in costs will reduce the profits in the current period, but increasing them in the long term will cause an increase, in profits due to increased intellectual capital compared to companies with low levels of structural capital, Yang’s study (2019), which was conducted on Australian companies during the period from 1990-2016, the study found that the efficiency of intellectual capital, especially human capital, increases the degree of stickiness due to management’s belief that intellectual capital will achieve economic benefits and enhance the company’s performance, and that the increase in Future sales resulting from the use of intellectual capital will absorb the cost of unused resources that were previously held when sales volume decreases, resulting in increased stickiness. This is consistent with the results of both the study of Mohamed (2022) which was applied to 36 companies listed on the Egyptian Stock Exchange during the period from 2018-2020, and the study of Badie et al. (2023) A study conducted on 156 companies listed on the Tehran Stock Exchange during the period from 2014-2020, found that the efficiency of human and structural capital increases the degree of stickiness, while the efficiency of employed capital reduces the degree of stickiness. Which is also consistent with the result of the study Yang & Chen (2023) conducted a study on 1036 Australian and Chinese companies during the period from 2018-2021 The study demonstrated that the efficiency of intellectual capital increases the degree of stickiness in both countries and that it is more evident in Australian companies. While the study of Nikbakht & Pourbagarian (2022), which was applied to 101 companies listed on the Tehran Stock Exchange during the period between 2008 and 2016 revealed that there was an inverse effect of both structural and human capital on anti-sticky cost behaviour. the study found no evidence of an effect of Employed capital in anti-sticky cost behaviour. Irawan (2021) study which was conducted on 119 industrial companies listed on the Indonesian Stock Exchange during the period from 2019-2020 showed that there is an inverse effect of intellectual capital on sticky cost behaviour. The levels of intellectual capital increase, this leads to a reduction in the degree of stickiness and thereby improving the financial performance of the company. The study by Santoso & Rachmawati (2019) which was conducted on 56 companies listed on the Indonesian Stock Exchange during the period from 2018-2019, and the study by Septiansyah & Asmara (2021) which was conducted on companies in the retail sector in the Indonesian Stock Exchange during the period from 2016-2019, did not find any effect of intellectual capital on sticky cost behaviour.
Asymmetric Cost Behaviour
The cost behaviour of an entity is defined as the degree to which costs are affected by changes in the volume of activity (Kuang & AlFaysal, 2021). The traditional view of cost behaviour is based on the microeconomic distinction of costs as fixed versus variable with respect to changes in the activity volume of the current fiscal year (Yang, 2019). In this mechanistic setting, the behaviour of total variable costs is contemporaneous, linear and symmetric with regards to both increases and decreases in sales volume. The magnitude of changes in variable costs is independent of the costs and activity volume of the prior fiscal year. Furthermore, managers do not explicitly influence cost behaviour through their decision making .The sticky cost phenomenon represents an alternative pattern of cost behaviour (Anderson et al., 2003). The literature on sticky cost distinguishes between costs that move mechanistically with changes in volume and those that are determined by resources committed by managers.
The term ‘sticky’ is used to describe costs that are difficult to alter when faced with an increase in economic activity. This is because the magnitude of the increase is greater than the magnitude of the decrease associated with an equivalent decrease in economic activity. In c certain instances, costs exhibit anti-sticky behaviour, whereby the cost response to a decrease in activity levels is greater than that observed in the case of an increase (Khayri, 2021; Hussain et al., 2021, Abdul Watab, 2021). The phenomenon of sticky cost behaviour has been attributed to the deliberate resource commitment decisions made by managers to maintain idle resources after volume declines. This has been observed in different cost categories (Yang & Chen, 2023). One of the most significant reasons for the persistence of expenses is the decision to incur current cost in order to avoid greater losses in the future, to gain more profit subsequently, to preserve the unused capacity in periods of revenue reduction in order to circumvent production capacity expenses, and to reduce the operational assets level, which is dependent on the management decisions in question (Pourbagherian & Nikbakht, 2021).
1) A managerial deliberate decision within the framework of economic factors contributing to expenses stickiness which results in the use of organizational resources in an undesirable manner (reduction in activity volume) and also the reduction of intangible assets.
2) The personal motives of managers, empire-building behaviour, and the use of adjustment expenses as influencing agents in expenses behaviour asymmetry.
3) The optimistic expectations of managers regarding activity level changes and economic status within the framework of expectation theory.
4) The signing of long-term contracts, the recruitment of workers with special abilities, and the consideration of information asymmetry in companies within the framework of information economics theory.
The existing literature has attempted to explain the phenomenon of sticky costs using a variety of factors. It has assumed that asymmetric cost behaviour is due to managerial behaviour, and thus has ignored the importance of intangible investments in allocation decisions managerial resources, and thus in asymmetric cost behaviour. The following section will explain the concept of intellectual capital, its components, and its relationship to asymmetric cost behaviour.
Intellectual capital
Intellectual capital represents a strategic resource that enables companies to achieve competitive advantages and superior financial performance. It is the driving force for companies to achieve success at the global level and it is the basic asset for the company’s long-term continuity (Nikbakht & Pourbagherian, 2022; Murti et al., 2023). The size of intangible assets is one of the factors influencing the ability of managers to make decisions regarding the preservation of untapped resources when the level of activity is low. Companies with high levels of intangible assets tend to have long-term orientations among their managers (Badie et al., 2023; Yang & Chen, 2023). This is because they view these assets as investments that contribute to long-term growth. Consequently, they are reluctant to reduce these investments when there is a temporary decrease in sales volume, which leads to increased stickiness in the costs related to those assets (Ramashar et al., 2019; Yang, 2019). In companies that view the consumption of resources related to internally developed intangible assets as expenses, there is a tendency to reduce them when a temporary decrease in sales volume occurs. This is done in order to improve the declared income and mitigate profit fluctuations between accounting periods. This leads to a lower degree of cost stickiness or may Cost behaviour turns into an anti-sticky behaviour relative to expenditures on intangible assets (Venieris et al., 2015; Yang, 2019; Nikbakht & Pourbagherian, 2022).
Intellectual capital includes both human capital, structural (organizational) capital, and employed capital (Ramashar et al., 2019; Yang, 2019). Human capital reflects the company’s collective ability to produce a wide range of the best solutions for company development and is derived from the knowledge possessed by its employees and includes: experience programs, training, competencies, recruitment, mentoring and learning programs in addition to individual potential (Venieris et al., 2015; Namazi & Fathali, 2017), as human capital efficiency is the basic element in information technology efficiency for its role in maintaining the competitive advantage of companies, and many economists have acknowledged that quality at work can be achieved and productivity and creativity enhanced by investing in human capital (Hamdan, 2018; Alamanda, 2019; Rehman et al., 2022), according to the Organization for Economic Co-operation and Development (OECD) (1996), assert that human capital efficiency is the main driver of economic activity, competitiveness and prosperity.
Structural capital is defined as the capabilities and knowledge used to combine human skills and physical capital with the objective of directing and supporting employees to achieve optimal business performance, and to produce and deliver products that satisfy customers. The term encompasses the company’s operating systems, manufacturing processes, organizational culture, management philosophy, wired communications technology, and wireless technologies. Structural capital may be defined as the collective knowledge that a company possesses at the end of the working day (Mohammadi & Taherkhani, 2017; Pourbagherian Nikbakht and , 2022; Ovechkin et al., 2021). While employed capital encompasses both physical and financial capital it excludes human and structural capital. An increase in the efficiency employed capital will result in a corresponding increase in the value of the company (Nikbakht &Pourbagherian, 2022; Yang & Chen, 2023).
In line with achieving the study’s goals, the hypotheses can be named as below:
H1: Marketing, administrative, and general costs in Egyptian industrial companies follow a sticky asymmetric behaviour.
H2: There is an effect of intellectual capital efficiency on the asymmetric behaviour of Selling, administrative, and general costs for industrial companies listed on the Egyptian financial market.
The main hypothesis is divided into the following sub-hypotheses:
H2.1: There is an effect of human capital on the asymmetric behaviour of Selling, administrative and general costs for industrial companies listed on the Egyptian financial market.
H2.2: There is an effect of structural capital on the asymmetric behaviour of Selling, administrative and general costs for industrial companies listed on the Egyptian financial market.
H2.3: There is an effect of employed capital on the asymmetric behaviour of Selling, administrative and general costs for industrial companies listed in the Egyptian financial market.
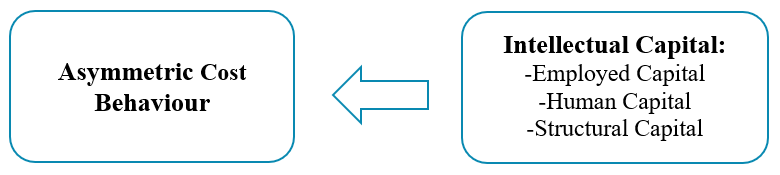
Figure 1. Search form
Data and Sample Selection
The research sample comprises all industrial companies listed on the Egyptian financial market, with the exception of those belonging to the financial sector. Firstly, it should be noted that the cost from those of industrial companies. Secondly companies that have changed their financial year.
Thirdly, companies that suspended trading for more than six months were included in the analysis, in addition to companies that required data that was not available. The number of companies that fulfilled the previous conditions reached (23) industrial companies for the period 2018-2022, with a total of (115) annual observations. Due to the presence of some outliers, (15) observations were excluded from the annual observations. These observations were excluded because the value of marketing, administrative, and general costs exceeded the value of revenues. Consequently, the number of final annual observations became (100) annual observations. Secondary data was collected from financial statements and annual reports published by the companies under study. The data was obtained from the Egyptian Financial Market website and analysed using Eviews 10 and SPSS.V.25.
Methods of Measuring Variables
Most studies in measuring Asymmetric Cost Behaviour have relied on the model (ABJ 2003), which was proposed by Anderson et al., (2003), which measures changes in marketing, administrative, and general costs in response to changes in sales revenue as follows:
Log ΔSA&Gi,t = β0+β1* LogΔREVit t +β2* DecDum * LogΔREVit+Ɛi,t
Whereas: Log ΔSG&Ai,t: Logarithm of the change in Selling, administrative, and general costs between period (t) and period (t-1) for company. LogΔREVit: Logarithm of the change in sales between period (t) and period (t-1) for company
I. DecDum: a dummy variable that takes one of two values (0) or (1).
DecDum * LogΔREVit: The product of the dummy variable multiplied by the logarithm of the change in sales, which reflects negative changes in revenues. β0: constant limit coefficient; β1: A coefficient that reflects the percentage increase in costs in response to the increase in revenue. β2: An indicator of asymmetric cost behaviour. So that the sum of (β2+β1) reflects the percentage decrease in costs in response to the decrease in revenues. If the sign of β2 is negative and statistically significant and the value of β1 is greater than the sum of (β2+β1) this indicates the presence of a sticky cost. However, if the sign of β2 is positive and statistically significant and the value of β1 is smaller than the sum of (β2+β1) this indicates the presence of an anti-sticky cost.
In both cases the value of β1 must be greater than (0); while symmetrical cost behaviour is achieved if the value of β1 equals (1) and the value of β2 equals (0).
Note: The model (ABJ) allows the introduction of new variables to explain asymmetric cost behaviour, so that the new variables are interactive, Then the ABJ model will be modified to become as follows:
Log ΔSA&Gi,t = β0+β1* LogΔREVit t +β2* DecDum * LogΔREVit+ β3 X1* DecDum * LogΔREVit+ Ɛi,t
Where: β3 is the value of the interactive variable, if the sign of β3 is negative and the sign of β2 is negative. There is a direct effect between the Sticky cost and the new variable and an inverse effect in the opposite case.
Intellectual Capital was measured based on the Value-Added Coefficient (VAIC) model presented by Pulic (2000) where the added value represents the difference between the outputs (the total income from all products sold in market) and inputs (all company expenses except labor costs). The value-added coefficient is calculated as follows (Ramashar et al., 2019):
VAICi = ECEi + HCEi + SCEi
Whereas:
VAICi: Value Added coefficient of Intellectual Capital of firm i
ECEi: Employed Capital Efficiency of firm i
HCEi: Human Capital Efficiency of firm i
SCEi: Structural Capital Efficiency of firm i
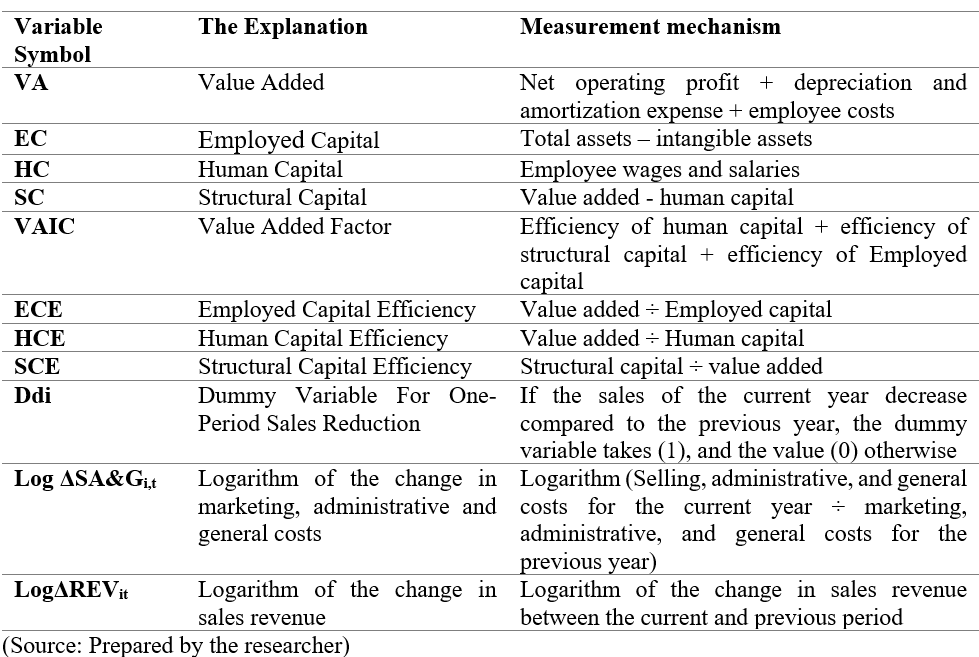
Table. 1 displays the mechanism for measuring all variables used in this research
Table 1. Research Variables and their Measurement Mechanism
Empirical Models to Test The Hypotheses:
Model1: Log ΔSA&Gi,t = β0+β1* LogΔREVit +β2* DecDum * LogΔREVit + εi,t
Model2: Log ΔSA&Gi,t = β0+β1* LogΔREVit t +β2* DecDum * LogΔREVit + β3* DecDum * LogΔREVit * HCE + εi,t
Model3: Log ΔSA&Gi,t = β0+β1* LogΔREVit +β2* DecDum * LogΔREVit + β3* DecDum * LogΔREVit * SCE + εi,t
Model4: Log ΔSA&Gi,t = β0+β1* LogΔREVit +β2* DecDum * LogΔREVit + β3* DecDum * LogΔREVit * ECE + εi,t
Empirical Results
This section will present the empirical results of the research. Firstly, the results of descriptive statistics will be presented, and a series of tests will be conducted to ensure that the data is suitable for statistical analysis, such as: testing the normal distribution of variables, choosing the multicollinearity issues, and testing the unit root to ensure that the variables are stable at the level. After that, the regression results will be displayed for all forms provided.
Descriptive Statistics
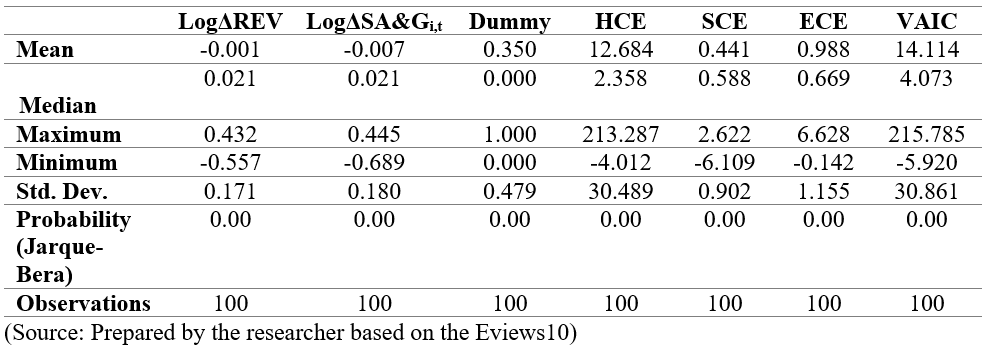
Table. 2 shows a summary of the descriptive statistics for the research variables, where the average value of the logarithm of the change in revenues reached (-0.001), with a standard deviation of (0.171), while the value of the arithmetic mean of the logarithm of the change in marketing, administrative, and general costs reached (-0.007) with a standard deviation.
It was (0.180), while the arithmetic mean values for each of the efficiency of human, structural and Employed capitalwere (12.684), (0.441), (0.988) with a standard deviation of (30.489), (0.902), (1.155). The upper and lower values of all variables were relatively far from the values of the mean. For example, the smallest value of the variable value added to intellectual capital (-5.920) was small compared to the upper value (215.785), and the same applies to the rest of the variables. As the previous table showed, the median for some The variables (logarithm of the change in revenues, logarithm of the change in Selling and administrative costs, logarithm of the change in cost of goods sold, and structural capital efficiency) were greater than the arithmetic mean, which indicates that the data distribution for these variables is skewed to the right, while the arithmetic mean for each of them was Human capital efficiency, Employed capital efficiency, and intellectual capital value added are greater than the median indicating that the data distribution curve for these variables is skewed to the left. The previous table also showed that the probability value of the Jarque-Bera statistic for all variables was greater than the 0.05 level of significance, which indicates that the distribution of the data is not normal and that data must be transformed using the inverse distribution method through the statistical package program SPSS.V.25.
Table 2. Descriptive Statistics for the Research Variables
Multicollinearity Test
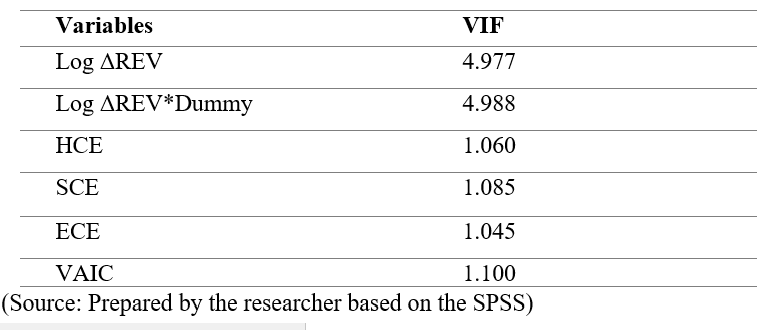
The variance inflation factor uses to ensure that there was no multicollinearity problem between the independent variables, Table. 3 presents the values of the variance inflation factor for the independent variables used in the research based on the statistical package program SPSS.V25. It is noted from the Table. 3 that the VIF value for each independent variable is less than 10, this indicating that there is no linear correlation problem between the variables under study.
Table 3. Results of the Variance Inflation Factor Test for the Variables Studied
Unit Root Test
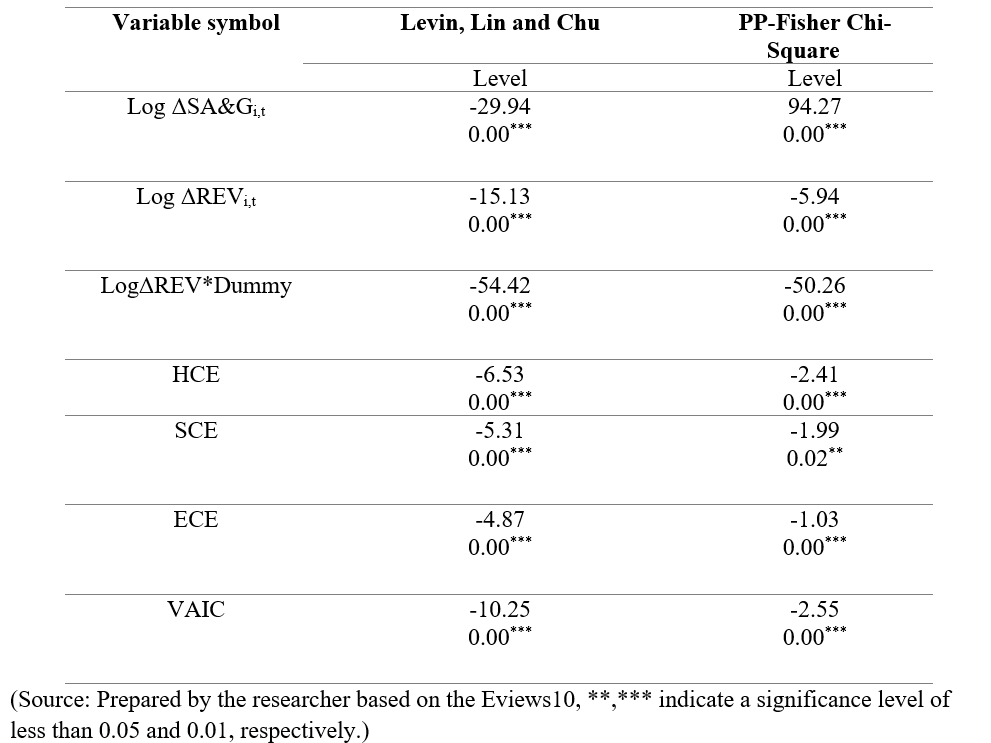
The unit root test is used to examine the stability of variables, the presence of a unit root indicates that the variables are unstable rendering the regression results are unreal and unreliable. Both tests have been applied to examine the stability of variables. Table. 4 demonstrates that the probability value of both the Levin, Lin and Chu test and the PP-Fisher Chi-Square test is less than the 0.05 level of significance, indicating that all variables are stable at the level at which they can be estimated using Panel Data models.
Table 4. Testing the Stability of the Research Variables
Model Estimation Results
Table. 5 displays the results of the analysis according to the Pooled regression model as the appropriate model for estimation, after a comparison was made between the aggregate regression model and the fixed effects model based on the Likelihood Ratio test, whose probability value was greater than the 0.05 level of significance.
The results of the regression analysis indicated that marketing, administrative, and general costs behave asymmetrically (sticky), as the value of the regression coefficient reached (0.834) β1, which is significant at a significance level of less than 0.05, which indicates that marketing and administrative costs increase by 0.834% when increasing Revenues increased by 1%, while the value of the regression coefficient β2 reached (-0.791), which is significant at a significance level of less than 0.05, while the sum of (β2+ β1) indicated that marketing, administrative and general costs decreased by 0.043% with an equivalent decrease in revenues of 1%. The value of the coefficient of determination, R-squared was (0.22). This means that the change in revenue explains about 22% of the changes occurring in Selling, administrative, and general costs, and that the regression model is significant and valid for prediction, as the probability value of the F-Statistic probability was smaller than the level of significance. 0.05, and there is no autocorrelation between the model residuals, as the value of the Durbin–Watson statistic was (2.2).
Table 5. Estimation Results of the First Model Related to Testing The Behaviour SA&Gi,t
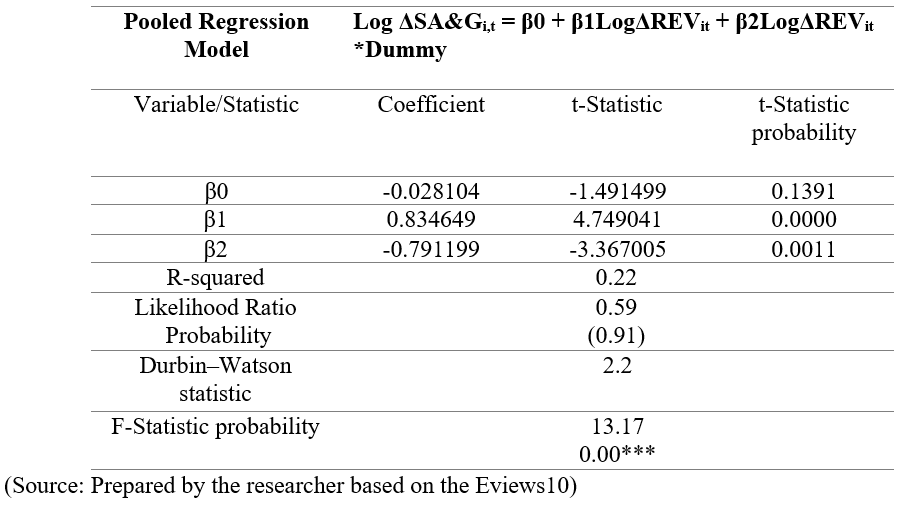
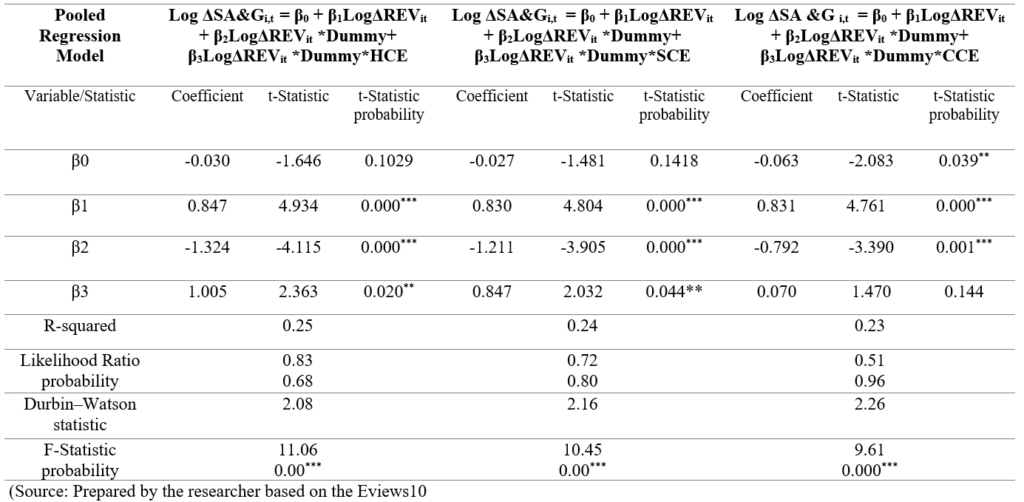
Table. 6 presents the results of the pooled regression analysis, where the value of the R-squared coefficient of determination for the three sub-hypotheses was (0.25), (0.24), (0.23), This suggests that human capital efficiency, structural capital efficiency, and employed capital efficiency collectively explain about 25%, 24% and 23% of the changes occurring in the asymmetric viscous behaviour of marketing, administrative and general costs, respectively. The coefficients for human capital efficiency, structural capital efficiency, and employed capital efficiency were positive and statistically significant at a significance level less than 0.05 and their value was, respectively (1.005), (0.847), (0.070). This indicates an inverse effect of human capital efficiency, structural capital efficiency, and employed capital efficiency on the asymmetric sticky behaviour of selling, administrative, and general costs. The table also showed that the probability value of the F statistic is less than the significance level of 0.05, which indicates that the regression models related to the previous hypotheses are valid for prediction and reliable in estimation, there was no autocorrelation between the model residuals, as the value of the Durbin-Watson statistic related to the regression models was (2.08), (2.16), (2.26).
Based on the above, it can be concluded that the management of industrial companies in Egypt did not give sufficient importance to intellectual capital, comprising its three components. A reduction in the volume of sales and investment in intellectual capital will be accompanied by a decrease in the degree of cost stickiness, according to what was shown by the sign of the coefficient β3 representing an interactive variable resulting from multiplying the change in intellectual capital by the decrease in sales volume.
Table 6. Results of Estimating Sub-Hypotheses
The objective of this research is to ascertain the impact of intellectual capital, comprising human capital, structural capital, and employed capital, on the asymmetric behaviour of marketing, administrative, and general costs. This will be achieved by analyzing secondary data for 23 industrial companies listed on the Egyptian stock market during the period 2018 – 2022.
The findings of the research indicated that selling, administrative, and general costs exhibited an asymmetric, stickiness related behaviour. Specifically, a 1% increase in sales volume was associated with a 0.83% increase in the volume of marketing, administrative, and general costs. Conversely a 1% decrease in sales volume was accompanied by a 0.04% (0.83-0.79) decrease in costs. The results also indicated that the interactive variables represented by the components of intellectual capital exerted an inverse effect on the behaviour of sticky costs. This suggests that industrial companies in Egypt viewed the consumption of resources associated with internally developed intangible assets as expenses rather than long-term investments. It was of great importance to reduce these expenses when the volume of sales decreased in order to improve the amount of profit disclosed in the financial statements and to reduce the fluctuations of accounting profits as much as possible. Therefore, when the volume of sales decreases and there is an increase in the volume of intellectual capital, the degree of stickiness of costs will decrease. This result was consistent with the findings of the study of Nikbakht & Pourbagarian (2019); Santoso & Rachmawati (2019); Irawan (2021), and Septiansyah & Asmara (2021), but inconsistent with those of Venieris et al. (2015); Mohammadi & Taherkhani (2017); Yang (2019), Muhammad (2022), Badie et al. (2023), Yang & Chen (2023).
The objective of this research is to ascertain the nature of the behaviour exhibited by selling, administrative and general costs and to evaluate the impact of intellectual capital on the behaviour of these costs by applying it to industrial companies in Egypt during the period from 2018-2022.
The research demonstrated that selling, administrative, and general costs exhibit a sticky asymmetric. Furthermore, the study revealed an inverse relationship between human, structural, and employed capital and the asymmetric behaviour of costs (SA&G). This indicates that Egyptian Companies management does not have a relatively long-term performance horizon with regard to the development of intangible assets. Consequently, they view selling administrative and general costs as an expense leading to a reduction or elimination of these expenses when sales volume declines resulting in lower commitment.
In light of the research results, the following recommendations can be made: The management of intellectual capital in a more appropriate manner, particularly in light of the explanatory power of the models that demonstrate the impact of intellectual capital with its three components on asymmetric marketing and administrative behaviour. Furthermore, and overhead costs are to be controlled by means of a cost leadership strategy, which allows for the reduction of unnecessary costs. Expenditures related to structural capital are to be maintained as much as possible. In the event that liquidity is not available, based on the required priorities, some cost items are to be removed in order to reduce costs. It is imperative to utilise the available capabilities of traded assets in manner that optimizes their value, thereby reducing cost stability.
One limitation of the research is the limited sample length of five years, Previous studies have employed samples of approximately ten years to analyse cost behaviour and the phenomenon of cost stickiness over a longer time frame. This can affect the comparability of results between the current research and existing research in other countries with different sample lengths. Incomplete information about companies led to their exclusion from the research sample. To observe asymmetric cost behaviour, the research focused on the industrial sector without other sectors.
In light of the limitations presented, we propose that future studies on cost stickiness consider a longer sample length and a more diverse range of intrinsic characteristics, such as the impact of intellectual capital and its components on other cost categories. The use of alternative models to assess intellectual capital and its constituent elements, coupled with the incorporation of variables that are postulated to exert an influence on the nexus between intellectual capital and asymmetric cost conduct, such as: political risks, unemployment rate, inflation, exchange rate, executive and personal characteristics of the manager, including excessive administrative confidence, and administrative ownership.
Journal Article
Thesis
Cite: Othman, H. N., & Hatem, I. M. (2024). The Effect of Intellectual Capital on the Asymmetric Behaviour of Costs A Case Study of Industrial Companies in Egypt. STEPS in BUSINESS EXCELLENCE, 2(1), 9–18. https://doi.org/10.61706/SBEXC12004

Copyright: © 2024 by the authors. Licensee SSG, Dubai, UAE.
This article is an open access article distributed under the terms and conditions of the Creative Commons Attribution (CC BY-NC-ND 4.0) license (http://creativecommons.org/licenses/by-nc-nd/4.0/).


An independent academic publisher with an editorial team including many of the top researchers in the world. SSG publishes research, review, and case report articles in double-blind, peer-reviewed, open access scientific and academic journals.
Copyright © 2025 Scientific Steps International Publishing Services LLC (Dubai – United Arab Emirates)