Volume 1, Issue 1, pp: 1-7
Predicting the Risks of Greenhouse Gases at Raising Temperatures in Syria Using Artificial Intelligence Models
Majd Fater Naamah 1, *, Wafaa Ali Rajab2
1, * Department of Agricultural Economics, Faculty of Agricultural Engineering, Tishreen University, Lattakia, Syria.
2 Department of Environmental Prevention, Higher Institute for Environmental Research, Tishreen University, Lattakia, Syria.
E-mail: mjd.namaa.90@gmail.com1, *, wrajab78@gmail.com2
* Correspondence Author
Received: 07 July 2023 | Revised: 17 December2023 | Accepted: 08 February 2024| Published: 10 March 2024
The research aimed to study the general trend of the evolution of greenhouse gas emissions in Syria during the period (1993-2022) and to predict the risks of greenhouse gas emissions to rising temperatures during the period (2023-2030). The research adopted the descriptive analytical method in estimating the equations of the general time trend of greenhouse gas emissions and calculating the annual growth rate for each of them during the studied period based on the statistics of the World Bank. The amount of gas emissions during the studied period was multi-layered to suit the nature of the data. The neural network used in prediction consisted of three layers: the input layer, the processing layer, and the output layer. The results of the research showed that there is a general trend of increasing temperatures at a rate of 0.16% annually, which is within the internationally permitted limits according to the Paris Agreement in 2015. The amount emitted of nitrous oxide gas occupied the highest relative importance in terms of the effect on temperature rise 100%, followed by the amount emitted of methane gas 94.1%. In contrast, the percentage of carbon dioxide emissions did not exceed 4.3% in the proposed model. The results of the prediction using the neural network model showed that the average temperatures during the coming period (2023-2030) will reach their maximum value in the year (2024) with an average of (14.87) degrees Celsius, with a relatively increasing annual growth rate of 0.07%.
Keywords: Greenhouse Gases, Risks, Artificial Intelligence, Temperatures, Syria.
Greenhouse gases constitute the primary source of temperature elevation, with methane playing a significant role, mainly produced in Syria through the decomposition of organic matter in oxygen-free environments. Approximately 40 % of methane is naturally produced, while the remaining 60 % is of anthropogenic origin, primarily associated with agricultural practices, particularly livestock farming, waste processing and the coal and oil industry.
In addition to these gases, nitrous oxide, often referred to as “laughing gas,” is primarily produced through intensive agricultural practices such as fertilization, the combustion of fossil fuels, and some industrial processes. Despite methane and nitrous oxide being present in the atmosphere at lower concentrations compared to carbon dioxide, their contribution to global warming is significantly greater. For example, the warming potential of nitrous oxide is 265 times higher than that of carbon dioxide.
It is indicated that approximately 75% of losses are attributable to extreme weather events. Climate change poses a threat of pushing an additional 100 million people into poverty by 2030. Another report from the World Bank, also funded by this institution, highlights that natural disasters have substantial and long-term effects on poverty(World Development Report 2016: Digital Dividends, n.d.).
The 2015 Paris Agreement establishes a global framework for constraining global warming to below 2°C, with a preferred target of 1.5°C, relative to pre-industrial levels (Grillakis et al., 2022). To achieve this temperature objective, nations strive to curb the increase in greenhouse gas emissions as soon as possible and subsequently implement rapid reductions, based on the best available science and considerations of economic and social feasibility (Everest Base Camp Trek | Everest Base Camp Trek Cost 2024-2025, n.d.).
A comprehensive review of literature was conducted concerning the utilization of neural network models and fuzzy logic across various environmental domains, including water treatment and weather forecasting. The results of the literature analysis revealed that the majority of AI-based prediction models have been employed in addressing issues related to water/wastewater treatment (55.7%) and air pollution (30.8%), whereas studies focusing on solid waste management comprise a smaller proportion (13.5%). Specifically, in the realm of air pollution, predictive models have been applied to forecast levels of ozone (O3), nitrogen dioxide (NO2), daily and/or hourly emissions of particulate matter (PM2.5 and PM10), sulfur dioxide (SO2) and carbon monoxide (CO). Conversely, in the context of solid waste management, researchers have conducted numerous investigations aimed at modeling the weight of generated waste, the composition of solid waste, and the overall rate of waste generation (Yetilmezsoy et al., 2011).
The 2012 Doha meeting marked a continuation of the Kyoto Protocol, a legally binding global agreement wherein participating nations committed to reducing their carbon emissions. Despite this supposed commitment, a notable increase in carbon emissions has been observed among all G20 countries, with the exception of France and the United Kingdom. China, in particular, has seen CO2 emissions surge by over 300% in the past 25 years (Tudor, 2016). As per the Doha Amendment to the Kyoto Protocol, Bahrain’s baseline level corresponding to 1990 stands at approximately 25.54 metric tons per capita, necessitating a maximum level of 20.96 metric tons per capita for 2020 (reflecting an 18% decrease relative to the baseline level) for Bahrain compliance. However, findings suggest that Bahrain is unlikely to achieve its presumed target (Tudor, 2016).
The effects of climate change on the dust phenomenon in the Zanjan region, northwestern Iran, were investigated utilizing a neural network (ANN) model extending until the year 2050. Particle concentrations were analyzed based on daily meteorological data from 2007 to 2018 and 1988 to 2018, directly from the city of Zanjan. The Long Ashton Research Station Weather Generator (LARS-WG 6.0) software was employed to estimate statistical errors and generate high-resolution synthetic time series climate datasets. Climate variables such as maximum and minimum temperature and precipitation were identified as predictive variables in the artificial neural network (Asadollahfardi et al., 2015). The results showed that the highest increase in PM10 levels occurred in May and July, while the lowest increase was observed in December, with monthly average of 84.85 and 50.54 µg/m3, respectively. The peak PM10 concentration was projected for the year 2043, reaching 74.26 µg/m3. Furthermore, the study highlighted significant relationships between PM10 concentrations and variables including minimum and maximum temperatures, as well as wind speed. Additionally, it was noted that pollutant levels increased with the enhancement of each atmospheric variable (Moghanlo et al., 2021).
Forecasting CO2 emissions is crucial for selecting optimal strategies to mitigate CO2 emissions effectively. The machine learning (ML) method employed in the IPCC model has demonstrated remarkable accuracy in predicting historical emissions, current emissions impacted by COVID-19, and future emissions. These expected results serve as valuable inputs for decision support systems aimed at formulating appropriate policies to reduce global carbon dioxide emissions. Future research endeavors may consider incorporating additional exogenous variables that influence CO2 emissions to enhance prediction accuracy further. Furthermore, predicting CO2 emissions influenced by COVID-19 using AI-driven machine learning methodology is an accurate process (Meng & Noman, 2022).
In light of global warming and the energy crisis, the Chinese government has set goals to achieve carbon peaking and carbon neutrality. With the rapid advancement of machine learning, several advanced machine learning algorithms have been applied to manage and predict carbon emissions due to their high efficiency and accuracy. The current state of machine learning applied to carbon emission forecasting was thoroughly examined (Zhao et al., 2023). The findings show that machine learning has emerged as a significant subject in the field of carbon emission forecasting models. The primary models for carbon emission forecasting predominantly rely on backpropagation neural networks, support vector machines, long short-term memory neural networks, and stochastic neural networks (Zhao et al., 2023).
A study conducted in Saudi Arabia utilized three powerful and efficient intelligent modeling methods: feed-forward neural network (FFNN), fuzzy network-based inference system (ANFIS), and long short-term memory (LSTM). These methods were applied within a network of FFNN, ANFIS, and LSTM. The results showed that the average error values for each method were 19.78, 20.89505, and 15.42295, respectively, while the average correlation coefficients were 0.990985, 0.98875, and 0.9945, respectively (Nassef et al., 2023). Each model was separately applied to predict CO2 emission values. In order to leverage the benefits of intelligent modeling tools, the final predicted value was determined as the average (combined) value of the outputs from the three model. To assess prediction accuracy, the group underwent validation with new measurements of the outputs from the three models. In 2021, the results revealed a calculated error rate of 6.8675% and an accuracy rate of 93.1325%, indicating a high level of accuracy for the model (Nassef et al., 2023).
Residual amounts of carbon dioxide, a phenomenon influenced by greenhouse gas emissions resulting from digital technology, were estimated in London. The results illustrate the significant accuracy of neural network estimation and emphasize the necessity for further evidence regarding the trade-off between greenhouse gas emissions resulting from technological advancements and the energy and resource efficiency gains achievable through AI. Effectively leveraging the opportunities presented by AI to address global climate change while mitigating associated risks necessitates swift, evidence-based, and efficient action, ultimately leading to a successful strategy (Cowls et al., 2023).
The study was conducted within the Syrian Arab Republic, located on the eastern coast of the Mediterranean Sea between longitudes 35° and 42° east of Greenwich, and latitudes 32° and 37° north of the equator, during the extended period from 1993 to 2022 (NASA agency).
Information regarding the quantities of greenhouse gas emissions (N2O), (CO2), and (CH4) were collected in kilotons, utilizing statistics from the World Bank during the period from 1993 to 2022. Additionally, temperature data was obtained from the Syrian General Directorate of Meteorology throughout the studied timeframe.
Independent variables: The emissions quantities of (N2O), (CO2), and (CH4) measured in kilotons.
Dependent variable: Temperature measured in degree Celsius (°C).
The research employed a descriptive analytical approach to estimate the equations of the general time trend of greenhouse gas emissions and to compute the annual growth rate for each gas during the study period, utilizing statistics from the World Bank. Additionally, artificial intelligence technology was utilized to develop a predictive model using a multi-layered perceptron neural network tailored to accommodate the dataset’s characteristics. The neural network employed in prediction comprised three layers: the input layer, the processing layer, and the output layer. Specifically, the input layer consisted of three cells representing the number of independent variables, while the processing layer consisted of three cells and the output layer comprised one cell, representing the number of dependent variables (Namaa et al., 2020).
There exists a prevailing trend of rising temperatures in Syria during the forthcoming period.
The study examined the annual rate of change in carbon dioxide emissions in Syria over the period from 1993 to 2022, as shown in Figure (1).
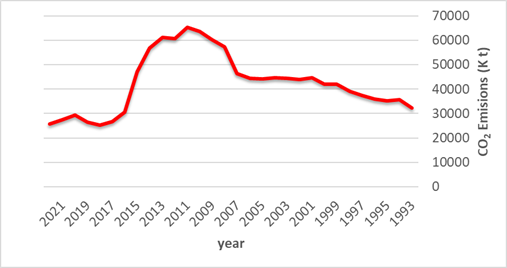
Figure 1. Evolution of CO2 (kilotons) during the period (1993-2022)
The amount of (CO2) emissions peaked in the year (2011), reaching approximately (65,280) kilotons, with an annual increase rate of2.64% compared to 2010. This increase can be attributed to rising industrial activity spurred by economic advancement. Subsequently, CO2 emissions declined to their lowest value in (2018), approximately (25,270) kilotons, with an annual decrease rate of -5.04% compared to 2017. This decline is attributed to economic recession and the prevailing conditions of war in the country.
An equation was derived to represent the general trend of (CO2) emissions, and the annual growth rate of these emissions was calculated for the period from 1993 to 2022, as presented in Table 1.
Table 1. Equation for the general trend of CO2 emissions in Syria during the period (1993-2022)

Source: Prepared by the researcher using the SPSS program.
The equation representing the general trend line for carbon dioxide emissions indicates a general declining trend during the period from 1993 to 2022, with an annual decline rate of -0.76%.
The annual rate of change of nitrous oxide emissions stemming from agriculture, biomass burning, industrial activities, and livestock management was investigated at the national level during the period from 1993 to 2022, as shown in Figure (2).
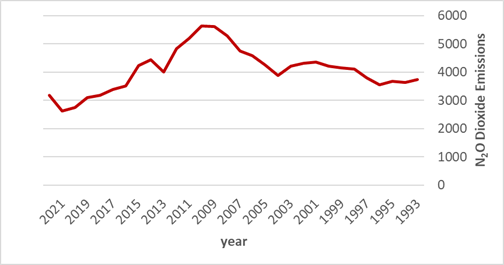
Figure 2. Nitrous oxide emissions (thousand metric tons of carbon dioxide equivalent).
The quantity of (N2O) gas emissions peaked in the year (2010), reaching approximately (5640) kilotons. This increase can be attributed to agricultural advancements, which peaked in the same year, along with intensive fertilization and accompanying control operations. Subsequently, N2O emissions decreased to their lowest level in 2021, approximately (2620) kilotons, due to a decline in agricultural activities resulting from war conditions.
An equation representing the general trend of (N2O) emissions was estimated, and the annual growth rate of these emissions was calculated for the period from 1993 to 2022, as shown in Table 2.
Table 2. Equation of the general trend of (N2O) emissions during the period (1993-2022)
Source: Prepared by the researcher using the SPSS program.
The equation representing the general trend line for nitrous oxide emissions indicates a general declining trend during the period from 1993 to 2022, with an annual decline rate of -0.52%.
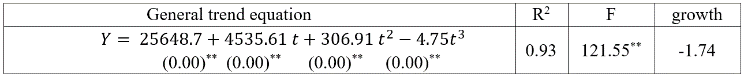
The annual rate of change of methane emissions originating from human activities such as agriculture, as well as from industrial methane production processes, was studied at the national level during the period from 1993 to 2022, as shown in Figure (3).
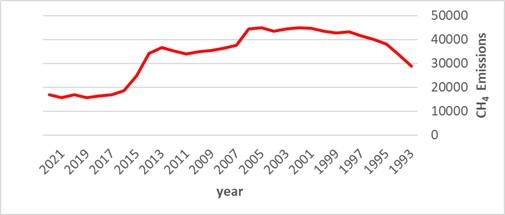
Figure 3. Methane emissions (ktCO2e)
The amount of CH4 gas emissions peaked in (2005), primarily due to emissions resulting from intensive agriculture and the extraction and production of fossil fuels. Subsequently, CH4 emissions declined to their lowest level in (2021), attributed to a decrease in agricultural and industrial activity resulting from the economic recession.
An equation representing the general trend of (CH4) emissions was estimated, and the annual growth rate of these emissions was calculated during the period from 1993 to 2022, as shown in Table 3.
Table 3. Equation for the general trend of (CH4) emissions in Syria (1993-2022)
Source: Prepared by the researcher using the SPSS program.
The equation representing the general trend line for methane gas emissions indicates a general declining trend during the period from 1993 to 2022, with an annual decline rate of -1.74%.
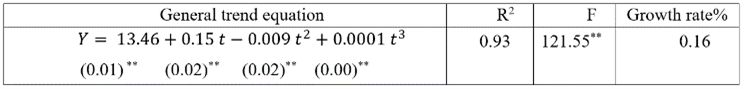
The average annual temperature change at the national level was studied during the period from 1993 to 2022, as shown in Figure (4).
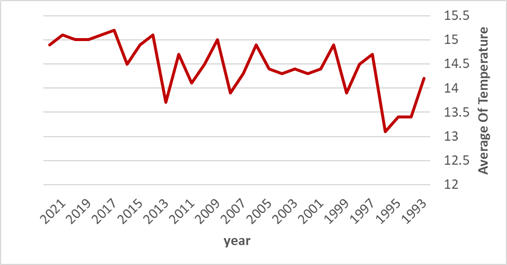
Figure 4. Evolution of temperatures in Syria during the period (1993-2022).
The average temperature peaked in (2017) at approximately (15.2°C), with an annual rate of change of 4.38%, representing a 4.83% increase compared to (2016). Subsequently, the temperature decreased to its lowest value in (1996), approximately (13.1°C), with an average annual change of (-2.24%) compared to (1995).
An equation describing the general temperature trend was estimated, and the annual growth rate was calculated for the period from 1993 to 2022, as shown in Table 4.
Table 4. Equation of the general temperature trend in Syria during the period (1993-2022)
Source: Prepared by the researcher using the SPSS program.
The equation representing the general temperature trend line indicates that there is a general increasing trend during the period from 1993 to 2022, with an annual growth rate of (0.16%). Importantly, this rate falls within the internationally permitted limits established by the Paris Agreement in 2015.
The quantities of greenhouse gas emissions (CO2, N2O, CH4) were utilized as independent variables, with the change in temperature served as the dependent variable. The time series data of the variables over a period of 30 years were used to train and test the network, as shown in Table 5.
Table 5. Summary of the processing process in the neural network

Source: Neural network output using SPSS program.
The 23 years of data used for training the neural network accounted for 76.7% of the total dataset, while the 7 years of data utilized for testing the network represented 23.3% of the dataset, as shown in Table 5.
The selected neural network was composed of three layers: the input layer, the processing layer, and the output layer. In the input layer, there were 3 cells, corresponding to the number of independent variables. The output layer contained one cell, representing the single dependent variable. The treatment layer consists of three cells, as detailed in Table 6.
Table 6. Information about the neural network used.
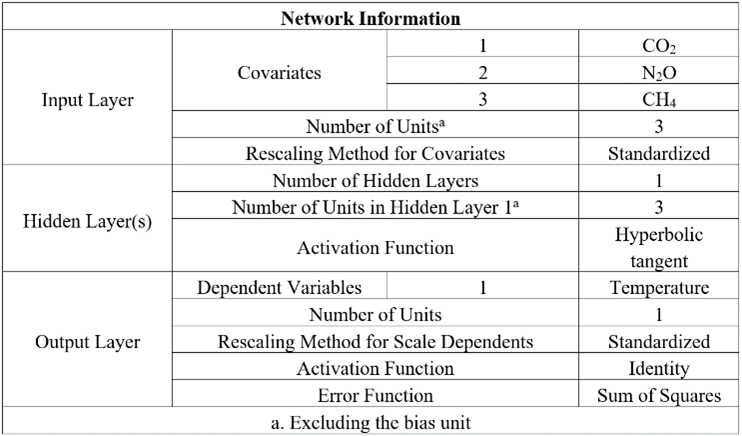
Source: Neural network output using SPSS program.
The hyperbolic function was used as the activation function in the hidden layer. This function, often referred to as the hyperbolic, is named as such due to its derivation from the hyperbolic function and its resemblance to trigonometric functions. Mathematically, it is expressed as follows (Namaa et al., 2020):
y: the dependent variable, c: the independent variables, and Bias: the bias parameter
The identity function, also known as the neutral or identical function, was used in the output layer. This function simply relates each element to itself, maintaining the same value. Mathematically, it can be represented as follows (Namaa et al., 2020):
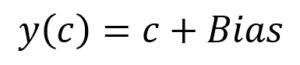
Figure (5) depicts the architecture of a neural network, comprising three layers of interconnected nodes: the input layer, the hidden layer, and the output layer. The nodes between the input and output layers can form one or more hidden layers. Neurons within each layer are fully connected to neurons in the next layer, but there are no connections between neurons within the same layer. The input layer receives information from the time series data, the hidden layer processes this information, and the output layer generates and predicts continuous values. Values from the input layer that are transmitted to the hidden node are multiplied by the weights, which constitute a set of predefined numbers. Subsequently, the products are added to yield a single number. This number serves as an argument for a nonlinear mathematical function known as the activation function. In this context, the hyperbolic function was used as the activation function in the hidden layer, while the identity function was utilized in the output layer (Namaa et al., 2020).
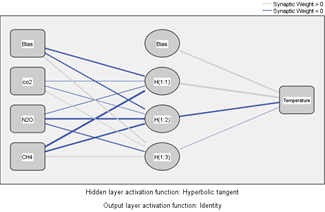
Figure 5. Perceptron MLP Architecture.
Figure (5) shows the structure of the neural network and the interconnections between its units, serving as conduits for feeding information into the network.
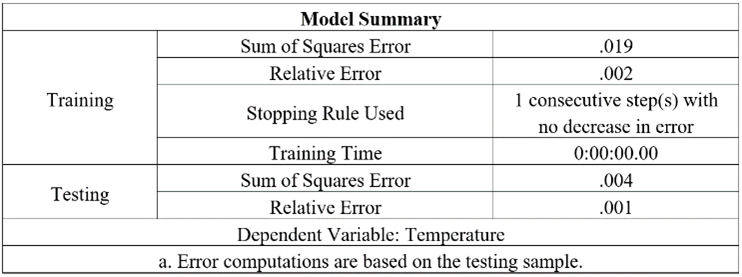
Table 7 provides a summary of the neural network model used, along with the sum of squared errors.
Table 7. Summary of the neural network model used.
Source: Neural network output using SPSS program.
Table (7) shows information regarding the results of training and testing. It includes cross-entropy error values for both the training and test sample, serving as the error function minimized by the network during the training phase. The sum of squared errors in the training phase was (0.019), reflecting the model’s predictive capability. The entropy error for the test sample (0.004) is lower than that for the training dataset, indicating that the network model is well fitted to the test phase.
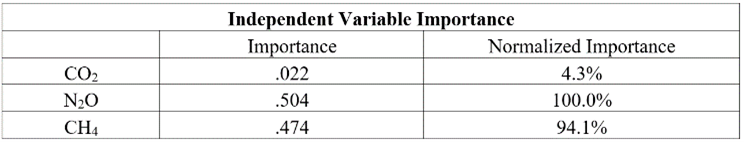
The relative importance of the independent variables in the influence of temperature varied according to the neural network model, as shown in Table 8.
Table 8. Relative importance of independent variables according to the network model.
Source: Neural network output using SPSS program.
The relative importance of the emitted gases in terms of their impact on temperature rise varied within the proposed model. Nitrous dioxide gas was found to have the highest relative importance, accounting for 100% of the effect on temperature rise. This was followed by methane gas emissions, which contributed to 94.1% of the effect. In contrast, carbon dioxide emissions had a significantly lower relative importance, accounting for only 4.3%.
Table 9. Results of temperature prediction in Syria during the period (2023-2030) using the neural network model.
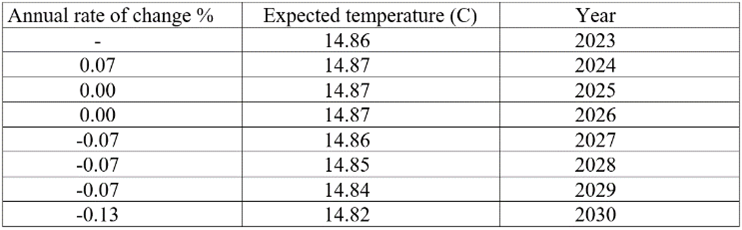
Source: Prepared by the researcher based on the output of the neural network.
The forecasting results using the neural network model showed that the temperature during the upcoming period from 2023 to 2030 will peak in the year 2024, reaching approximately 14.87°C, with a relatively increasing annual rate of 0.07%. Subsequently, the temperature is projected to slightly decrease to about 14.82°C by the year 2030.
It is not advisable to rely on multiple linear regression models for predicting time series data, as they often yield, they give inaccurate results. In the study of greenhouse gas emissions over the period from 1993 to 2022 in Syria, a general declining trend was observed, while temperatures showed an increasing trend. However, the predictive results using the neural network suggest a general increase in temperatures during the upcoming period. Additionally, the study highlights nitrous dioxide gas as one of the most significant greenhouse gases influencing heat, aligning with scientific theory, which confirms that the effect of nitrous dioxide gas is equivalent to 300 times that of carbon dioxide gas. As a recommendation, the research advises rationalizing the use of fertilizers and pesticides to reduce nitrogenous processes in the soil, which serve as the primary source of nitrous dioxide gas emissions.
Asadollahfardi, G., Mehdinejad, M., Mirmohammadi, M., & Asadollahfardi, R. (2015). Predicting Atmospheric Concentrations of Benzene in the Southeast of Tehran using Artificial Neural Network. Asian Journal of Atmospheric Environment, 9(1), 12–21. https://doi.org/10.5572/ajae.2015.9.1.012
Cowls, J., Tsamados, A., Taddeo, M., & Floridi, L. (2023). The AI gambit: leveraging artificial intelligence to combat climate change—opportunities, challenges, and recommendations. AI & SOCIETY, 38(1), 283–307. https://doi.org/10.1007/s00146-021-01294-x
Everest Base Camp Trek | Everest Base Camp Trek Cost 2024-2025. (n.d.). Retrieved March 9, 2024, from https://www.adventurewhitemountain.com/everest-base-camp-trek
Grillakis, M. G., Kapetanakis, E. G., & Goumenaki, E. (2022). Climate change implications for olive flowering in Crete, Greece: projections based on historical data. Climatic Change, 175(1–2), 7. https://doi.org/10.1007/s10584-022-03462-4
Meng, Y., & Noman, H. (2022). Predicting CO2 Emission Footprint Using AI through Machine Learning. Atmosphere, 13(11), 1871. https://doi.org/10.3390/atmos13111871
Moghanlo, S., Alavinejad, M., Oskoei, V., Najafi Saleh, H., Mohammadi, A. A., Mohammadi, H., & DerakhshanNejad, Z. (2021). Using artificial neural networks to model the impacts of climate change on dust phenomenon in the Zanjan region, north-west Iran. Urban Climate, 35, 100750. https://doi.org/10.1016/j.uclim.2020.100750
Namaa, M., Yacoub, G., & Achouch, A. (2020). Building a Predictive Model for Tobacco Production in Syria Using the Multi-Layer Neural Network (Perceptron MLP). SSRG International Journal of Agriculture & Environmental Science, 7(4), 69–77. https://doi.org/10.14445/23942568/IJAES-V7I4P110
Nassef, A. M., Olabi, A. G., Rezk, H., & Abdelkareem, M. A. (2023). Application of Artificial Intelligence to Predict CO2 Emissions: Critical Step towards Sustainable Environment. Sustainability, 15(9), 7648. https://doi.org/10.3390/su15097648
Tudor, C. (2016). Predicting the Evolution of CO2 Emissions in Bahrain with Automated Forecasting Methods. Sustainability, 8(9), 923. https://doi.org/10.3390/su8090923
World Development Report 2016: Digital Dividends. (n.d.). Retrieved March 9, 2024, from https://www.worldbank.org/en/publication/wdr2016
Yetilmezsoy, K., Ozkaya, B., & Cakmakci, M. (2011). Artificial Intelligence-Based Prediction Models for Environmental Engineering. Neural Network World, 21(3), 193–218. https://doi.org/10.14311/NNW.2011.21.012
Zhao, Y., Liu, R., Liu, Z., Liu, L., Wang, J., & Liu, W. (2023). A Review of Macroscopic Carbon Emission Prediction Model Based on Machine Learning. Sustainability, 15(8), 6876. https://doi.org/10.3390/su15086876
Cite: Namaa, M., & Rajab, W. (2024). Predicting the Risks of Greenhouse Gases at Raising Temperatures in Syria Using Artificial Intelligence Models. Steps in Ecological Sciences, 1(1), 1–7. https://doi.org/10.61706/aecs15001
![]() Copyright: © 2024 by the authors. Licensee Scientific Steps International Publishing Services, Dubai, UAE.
Copyright: © 2024 by the authors. Licensee Scientific Steps International Publishing Services, Dubai, UAE.
This article is an open access article distributed under the terms and conditions of the Creative Commons Attribution (CC BY) license (https://creativecommons.org/licenses/by/4.0/).


An independent academic publisher with an editorial team including many of the top researchers in the world. SSG publishes research, review, and case report articles in double-blind, peer-reviewed, open access scientific and academic journals.
Copyright © 2025 Scientific Steps International Publishing Services LLC (Dubai – United Arab Emirates)