
ISSN: 3005-8198 (online) | 3005-818X (print)
Volume 2, Issue 1 (January - March 2024) Pages 22-34
General Organization of Remote Sensing (GORS), Damascus, Syria.
As the spectral data of the space image increases, the amount of information derived by processing per unit terrestrial area is amplified. A hyperspectral image is capable of mapping the classified features in accordance with defined objectives, and of providing a description of each objective in quantitative terms. A model for mapping gypsum quantity using spectral libraries and the SAM technique on a hyperspectral image was implemented. The distribution of gypsum was mapped for areas exceeding 50% (per unit area), covering 1188 ha, and exceeding 70% (per unit area), covering 932 ha, and exceeding 85% (per unit area), covering 395 ha, along the study area of Jayroud, Damascus countryside. The model performance with respect to static indicators was as follows: the accuracy assessment value was -11.5, the root mean square error (RMSE) was 10.25, and the coefficient of determination (R²) was 0.94 for gypsum estimation in comparison with field observations. Maps of gypsum quantification and distribution are instrumental in the optimal investment planning and effective sustainable management of this resource.
Keywords: Hyperspectral Images, Detection, Quantifying, Resource Sustainability, Gypsum.
As the spectral data of the space image increases, the amount of information derived by processing per unit terrestrial area also increases. At the initial stage of the process, which involves mapping the classified features into defined objectives and taxonomic categories, the objective is merely to describe and estimate the quantity of each of these objectives. Hyperspectral images provide an enormous amount of spectral data for all features present in the image. However, hyperspectral image processing algorithms and workflows are fundamentally different from those used for multispectral images (Smith, 2012; Yoon & Park, 2015).
The measurement of the spectral reflectance of the objects under study across a wide spectral range and with high spectral accuracy is regarded as one of the most crucial techniques for classifying these objects and determining the degree of similarity and dissimilarity between them. In addition to determining the percentage of participation of an element in a compound, it is also possible to quantify the presence of this characteristic per unit area (Ehrenfeld et al., 2023). The spectral reflectance at each wavelength is regarded as an outcome that reflects both the physical and chemical attributes of the subject matter, facilitating the expeditious identification of physical characteristics that are not readily discernible and numerous chemical properties that necessitate laboratory-based analyses (Ehrenfeld et al., 2023; Smith, 2012; Sowmya et al., 2019).
Hyperspectral remote sensing is the primary source of information for mapping and exploring minerals (Ehrenfeld et al., 2023; Gan & Wang, 2007; Kruse, 2012; Laakso et al., 2015; Schaepman et al., 2009; Sneha & Kaul, 2022; van der Meer et al., 2012; Yu et al., 2020). In addition, the original mineral was identified as a polymetallic ore comprising gold, silver, lead, and zinc (Wan et al., 2021). The mineral map also included copper and iron (Habashi et al., 2024). Furthermore, AL+OH minerals were detected (Satpathy et al., 2010), and materials on the object were identified (Vasile et al., 2024), basaltic exposures (Ibrahem N, 2015), gypsum (Chatrenor et al., 2020; Fasnacht et al., 2019; Milewski et al., 2019), characterization of different rocks and qualitative analysis to quantitative recognition (Arvelyna et al., 2011; Xu et al., 2010). Black et al. (2016) and Thompson (2013) have also contributed to this field (Black et al., 2016; Thompson et al., 2013). The exploration of solid minerals and oil and gas (Bishop et al., 2011; Liu et al., 2017) are additional areas of interest. The study of nutrients, organic carbon, moisture, salinization, and soil texture (Sowmya et al., 2019; Yu et al., 2020) represents another important aspect of this research.
Hyperspectral image techniques are employed for a variety of purposes, including identification, classification, categorization, assessment, and mapping. Examples of such techniques include Support Vector Machines (SVM) (Chatrenor et al., 2020; Gleeson et al., 2010), Spectral Angle Mapper (SAM). (Al-Allan et al., 2013; Bharti et al., 2015; Ibrahem N, 2015; Shrestha et al., 2005; Wan et al., 2021) proposed the use of Spectral Feature Fitting (SFF) (Sowmya et al., 2019), Match Filtering (MF) (Wan et al., 2021), and Spectral Mixture Analysis (SMA) (Dutkiewicz et al., 2009; Gleeson et al., 2010) for hyperspectral image analysis. Other relevant studies on target detection (Sneha & Kaul, 2022), minimum noise fraction transform (Wan et al., 2021), recognition targets (Matteoli et al., 2018), by Zhang et al. (2011) and Ibrahem (20 15. Chattoraj et al. (2020), Feng et al. (2018), spectral libraries and expert systems(Chattoraj et al., 2020; Feng et al., 2018; Ibrahem N, 2015; Zhang et al., 2011), artificial neural networks (Fasnacht et al., 2019; Li et al., 2019), machine learning (Ehrenfeld et al., 2023; Li et al., 2019; Vasile et al., 2024).
The majority of hyperspectral studies focusing on gypsum have employed a variety of hyperspectral techniques to identify and classify gypsum (Chatrenor et al., 2020; Fasnacht et al., 2019). Additionally, some studies have utilized hyperspectral remote sensing data to predict gypsum content and assess absolute quantification (Milewski et al., 2019). All hyperspectral studies working on gypsum assessment require an extensive training data set or rely on scene-dependent selection of target spectra for the gypsum analysis. Furthermore, they do not provide quantitative estimates of gypsum.
Gypsum (hydrated calcium sulfate, CaSO₄.2H₂O) is regarded as one of the most abundant raw materials found in the Earth’s crust. Gypsum is the most pervasive sulfurous mineral in nature, occurring on the Earth’s surface or at depths reaching 350 meters. It is a widely utilized building material and an important component in the decorative industry. Additionally, gypsum is utilized in agricultural, medical, and educational contexts (Wikipedia contributors, 2024).
In this study, spectral gypsum models were generated based on hyperspectral data within the wavelength range of 350 to 2500 nanometers of gypsum under five standard levels (50, 60, 70, 80, and 90%). The application of spectral gypsum models and hyperspectral imaging enabled the generation of maps of gypsum percent (exceeding 50%, 70%, and 85%) for the Jayroud region, situated to the northeast of Damascus in Syria. These maps facilitate the planning of optimal investment and sustainable resource management.
The research methodology is based on the flowchart architecture (Figure 1) and employs the following materials and methods:
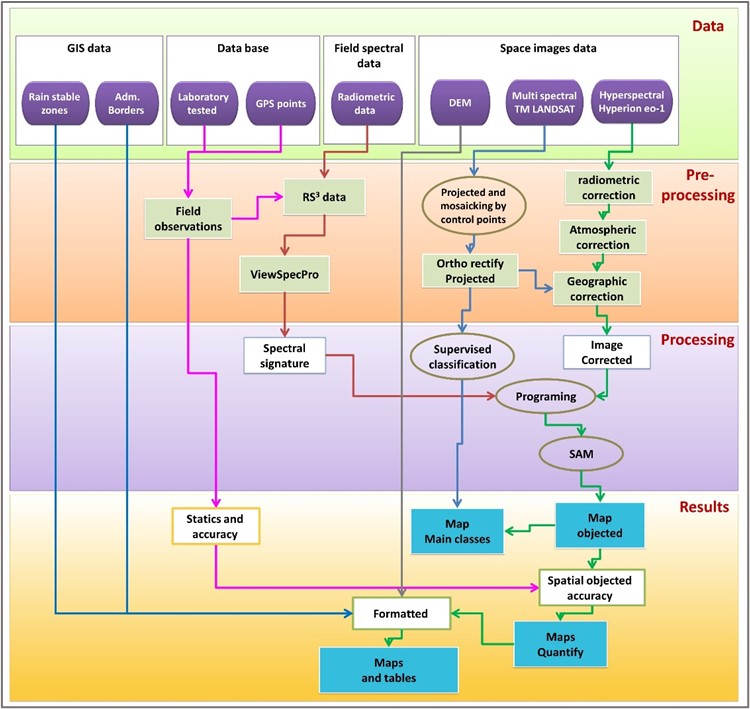
Figure 1. Flowchart of Research Methodology.
The study area is situated in the northeast region of the city of Damascus. It is administratively affiliated with the Jayroud region of the Damascus Governorate, as illustrated in Figure 2.
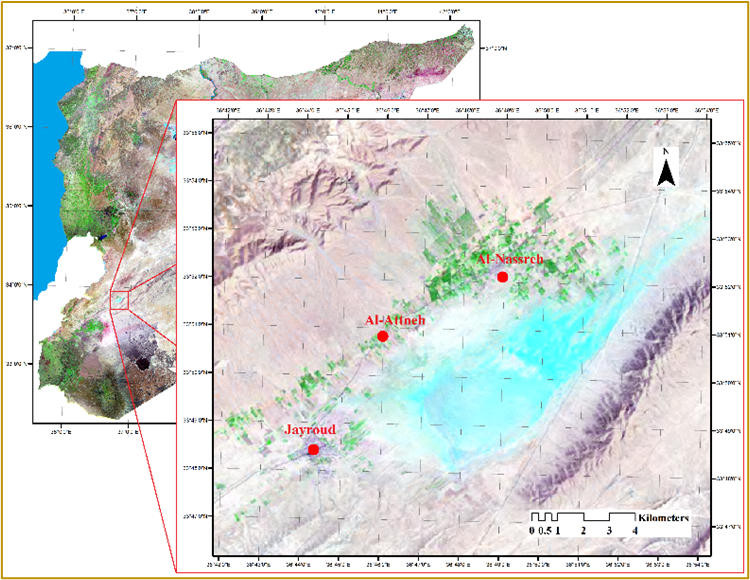
Figure 2. Geographic Location of the Study Area on the Space Image of the Syria
The hyperspectral space image of Hyperion comprises 242 spectral channels captured within the wavelength range of 355-2577 nm, with a wavelength range of 10-12 nm and a spatial resolution of 25 m. The image utilized in this study is designated as EO1H1730362004297110PE. The acronym PE denotes the satellite EO1, which is designated Earth Observation 1, the Hyperion sensor, the path number 173, and the row number 036. This image was captured in the year 2004, during the 297th day of the Julian period, specifically on October 23, 2004. The “1” that follows the “297” indicates that the Hyperion sensor is operational. The second digit indicates that the ALI sensor is active. The absence of a digit zero indicates that the AC sensor is off. P is a code for the pointing mode, and E is the code for the scene length (Pearlman et al., 2003). Hyperion was designed by NASA as one of the sensor systems on the Earth Observation (EO-1) platform in 2001. Figure 3a depicts the hyperspectral image of the study area in true colors, while Figure 3b illustrates the spectral composition of this hyperspectral image.
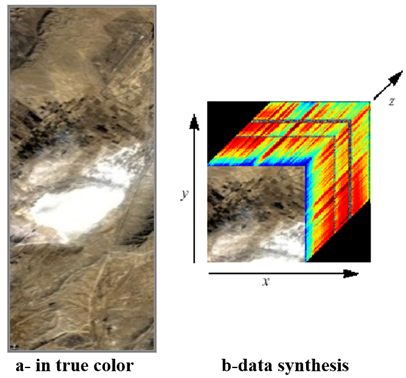
Figure 3. Hyperspectral Image of the Study Area
Multi-spectral images with a spatial resolution of 15 meters were obtained from the TM Landsat satellite. These images were projected and mosaicked by control points in GORS (General Organization of Remote Sensing) in 2009. The resulting images are presented in Figures 2 and 4.
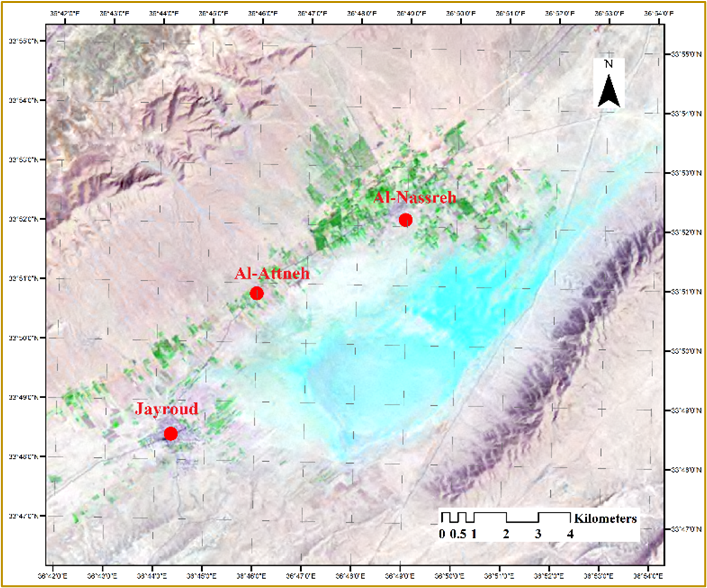
Figure 4. TM Image of the Study Area
The topography is illustrated by a digital elevation model (DEM) image (Figure 5) with a resolution of 30 meters (SRTM). The study area is situated at an average altitude of 777±15 meters above sea level.
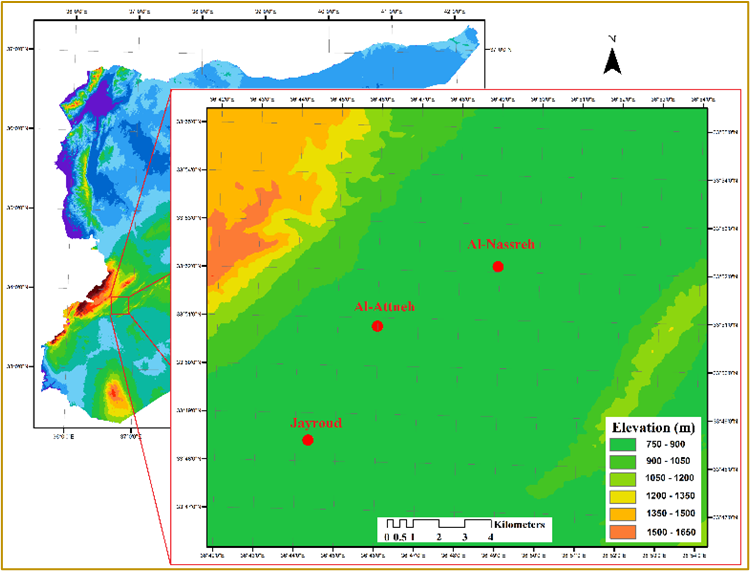
Figure 5. DEM Image of the Study Area
Map of Rain-Stable Zones in Syria (Figure 6). The study area is situated within the fifth rain stability zone, with an annual rainfall of less than 150 mm. In arid and semi-arid regions, the accumulation of the evaporite mineral gypsum (Herrero et al., 2009) can have a significant impact on soil and sedimentary processes.
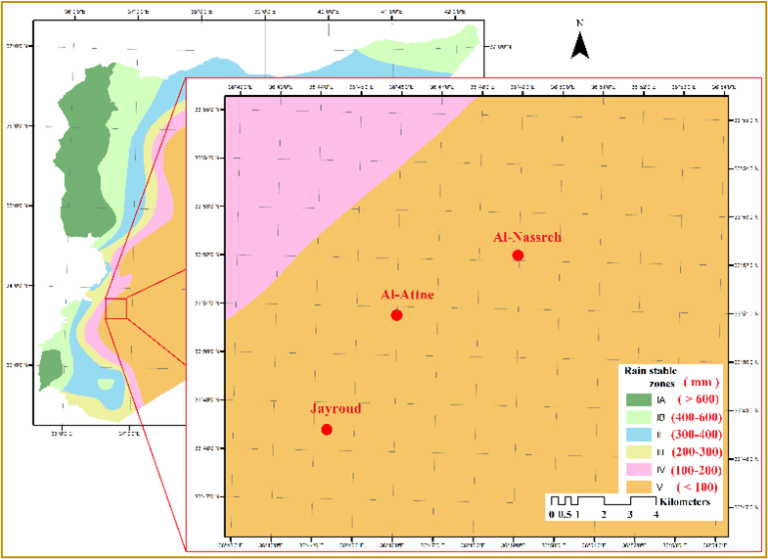
Figure 6. Map of Rain Stable Zones for the Study Area
The field spectral data were obtained using a FieldSpec®Pro spectroradiometer (Figure 7) within the spectral range of 350-2500 nm at a resolution of 1 nm with 2150 spectral channels.
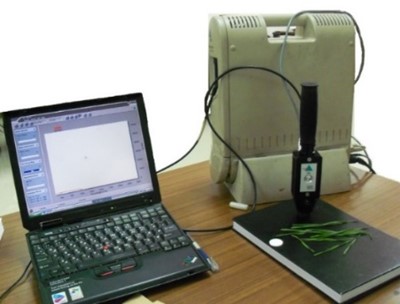
Figure 7. FieldSpec®Pro Device for Measuring Spectral Reflectance in the Field
The geographical coordinates of field points are determined by a Global Positioning System (GPS) device of the Garmin etrex type (Figure 8).
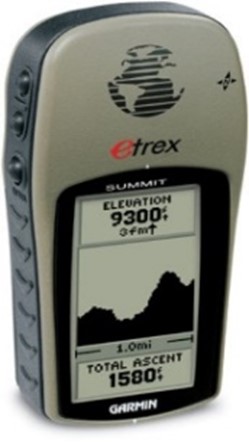
Figure 8. Garmin Etrex GPS device
Hyperspectral Image Corrections
One of the primary image acquisition processes is radiometric correction and calibration (Chang, 2003; Sneha & Kaul, 2022). A total of 242 distinct spectral channels were collected, encompassing a comprehensive spectrum from 355 to 2577 nanometers. The Level 1 radiometric product comprises a total of 242 bands, of which only 198 have been calibrated. The calibrated channels for the visible-near infrared (VNIR) range are 8-57, while the same range for the shortwave infrared (SWIR) is 77-224. The rationale for not calibrating all 242 channels primarily stems from the detector’s low responsivity. The uncalibrated bands are set to zero on those channels. A total of 196 unique channels are present (Longhenry, 2020), due to an overlap between the VNIR and SWIR focal planes. This overlap is observed between the VNIR band 56 (915.23 nm) and 57 (925.41 nm) and the SWIR band 77 (912.45 nm) and 78 (922.54 nm). In the experiment, all uncalibrated bands and bands 77 and 78 are removed prior to further processing. The digital values of the Level 1 product are 16-bit radiances and are stored as a 16-bit signed integer. Scaling factors of 80 and 40, respectively, are applied to the SWIR and VNIR bands. The units are W/m² SRm (Longhenry, 2020).
VNIR L = Digital Number / 40
SWIR L = Digital Number / 80
Due to the absorption and scattering of solar radiation by atmospheric gases and aerosols along the path between the sun and the sensor in the visible and near-infrared spectral regions, the hyperspectral imaging data is influenced by atmospheric effects. In order to employ hyperspectral imaging data for quantitative remote sensing of land surfaces, it is necessary to remove the atmospheric effects. (Gao et al., 2009; Sneha & Kaul, 2022).
The FLAASH (Fast Line-of-sight Atmospheric Analysis of Spectral Hypercubes) technique is employed for the purpose of atmospheric correction. FLAASH is designed to eliminate atmospheric effects caused by molecular and particulate scattering and absorption from the radiance at the sensor and to obtain reflectance at the surface. The FLAASH atmospheric correction code, which derives its physics-based algorithm from the MODTRAN4 radiative transfer code (Felde et al., 2003), is capable of correcting for atmospheric effects. Figure 9 illustrates the spectral profile of a pixel before (Figure 9a) and after (Figure 9b) atmospheric correction.
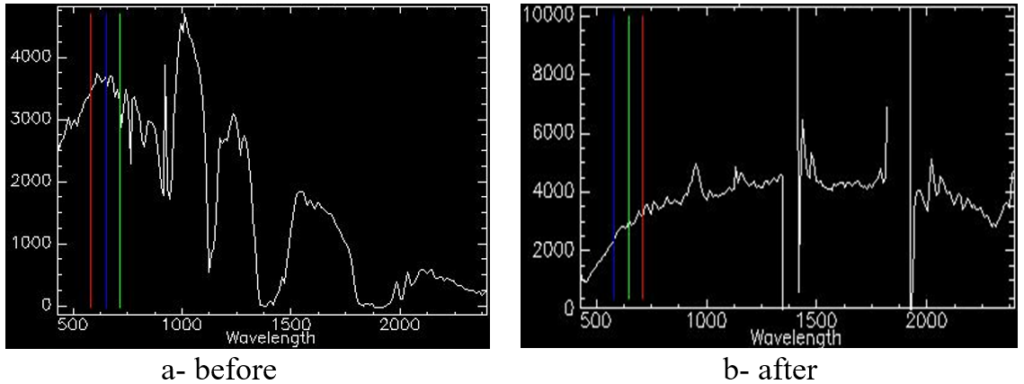
Figure 9. Spectral Profile of Pixel: Before (a) and After (b) Atmospheric Correction
The hyperspectral space image was corrected geometrically (Chang, 2003) in accordance with the TM LANDSAT image projected for Syria, which was prepared by GORS (Figure 1). Figure 10 illustrates the space image before (Figure 10a) and after (Figure 10b) geometric correction.
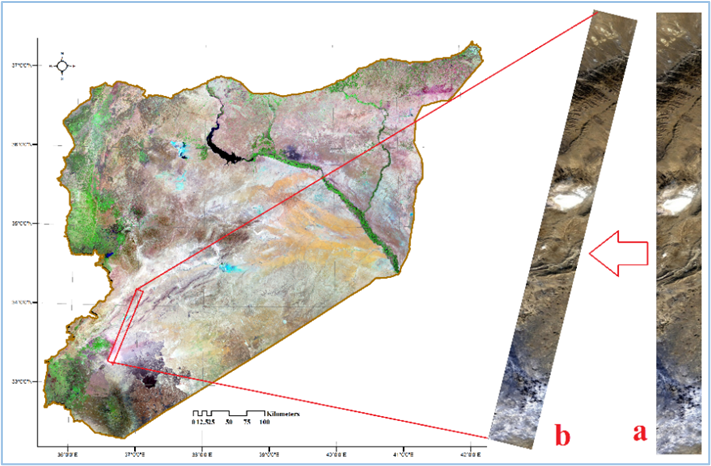
Figure 10. Hyperion EO-1 Image of the Study Area Before (a) and After (b) Geometric Correction.
Field Spectral Data Formatting
On October 10, 2019, radiometric spectral readings for gypsum percent at five levels (50, 60, 70, 80, and 90%) were recorded using the radiometric RS3 program. The spectral data records were displayed and analyzed using the ViewSpecPro program. The spectral reflectance data were formatted using the Excel program to facilitate the visualization of the spectral signature (within the range of 350 to 2500 nm) of gypsum at the five specified percent levels (Figure 11).
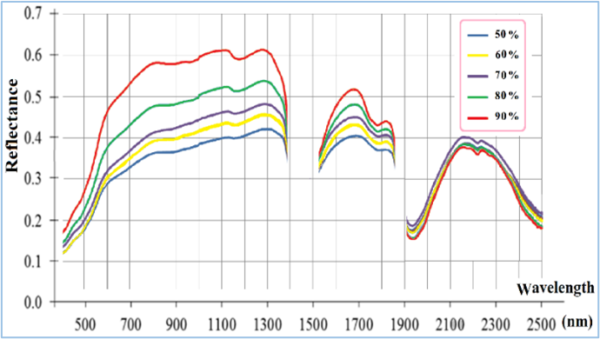
Figure 11. Spectral Signature of Gypsum at 5 Standard Levels.
The spectral signature of gypsum exhibited a curved dependence on wavelength and on the percent of gypsum in the scene reflectance (unit area). As the percentage of gypsum increased, the spectral reflectance value exhibited a positive correlation in the range of 350–1850 nm, while displaying a negative correlation in the range of 1900–2500 nm. As the percentage of gypsum in a given sample increase, the reflectance values of the sample’s spectra exhibit an overall increase within the range of 350–1850 nm. There was a significant discrepancy between the recorded spectra reflectance values as the gypsum percent varied in the ranges of 800–1350 nm and 1600–1720 nm. This finding aligns with the observations made by Ehrenfeld et al. (2023). It is evident that supervised analysis using spectral data necessitates a comprehensive understanding of the response variables and a substantial number of spectral data points.
The objective is to program the spectral signature of gypsum in the form of spectral libraries. The implementation of spectral libraries in the corrected hyperspectral image is achieved through the utilization of the Spectral Angle Mapper (SAM) technique, which facilitates the mapping of gypsum percent. The Spectral Angle Mapper (SAM) is a method that relies on a comparison between the target spectrum and a reference spectrum (which is determined in a laboratory setting) and the target spectrum in the corrected image. In the classification process, this method employs a stereoscopic angle (n dimensions) to align the pixels with the reference spectrum. This function determines the spectral similarity between two spectra by calculating the angle between the two spectra and treating them as rays in a space whose dimensions are equal to the number of spectral channels. Each ray has a specific length and direction, with the length of the beam representing the brightness in the pixel and the direction representing the spectral characteristic of the pixel. A spectral angle may be represented between two bands in a plane, as illustrated in Figure 12a, or between three spectral bands (i.e., a three-dimensional space), as shown in Figure 12b (Kruse et al., 1993).

Figure 12. SAM Between Two Spectra in the Plane (a) and Three-Dimensional Space (b)
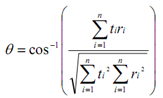
This method determines the degree of similarity between an unknown spectrum (t) and a reference spectrum (r) in an n-dimensional space, where n represents the number of spectral channels present in the image. This is achieved by applying the following equation, as proposed by Kruse et al. (1993):
The spectral libraries of gypsum at varying levels utilized by the SAM technique for gypsum mapping quantification yielded three maps of gypsum presence per terrestrial unit. Figure 13 illustrates the geographical distribution of gypsum percent mapped across three quantifying ranges.
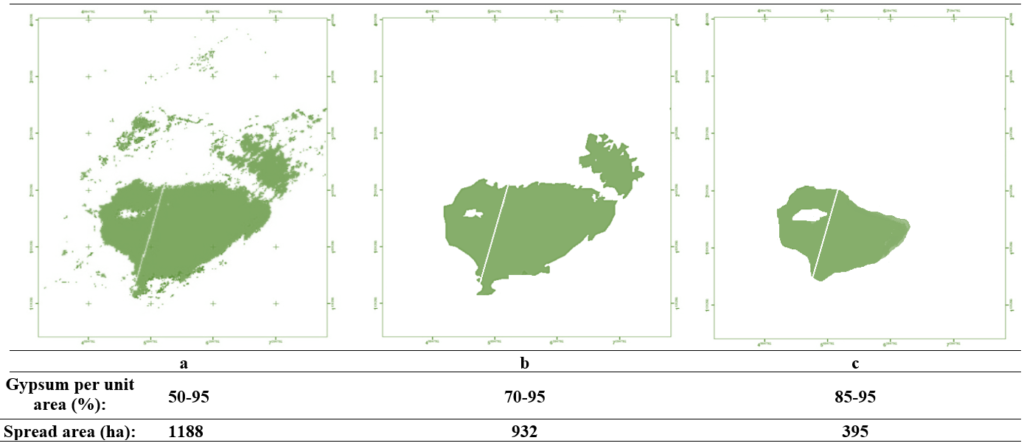
Figure 13. Maps of Gypsum Percent and Spread for Jayroud Region.
Figure 13a depicts the geographic distribution of gypsum, which has spread over an area exceeding 50% of the total area (25*25m) and encompasses 1188 ha. Figure 13b illustrates the spread of gypsum exceeding 70%, encompassing an area of 932 hectares. Additionally, the map in Figure 13c depicts the spread of gypsum exceeding 85% and occupying 395 ha. This result is more precise and encompasses a broader range of wavelengths than those determined by Milewski et al. (2019). Maps that quantify gypsum and its distribution are invaluable for optimal investment planning and effective, sustainable management of this resource.
The efficacy of hyperspectral image-based gypsum map quantification was evaluated through a comparative analysis of field observations and the resulting accuracy assessment. A total of 48 field locations were selected based on the gypsum maps, which represent three distinct quantity levels (Figure 14). Twenty field locations exhibited gypsum levels between 50 and 70%, while fifteen locations demonstrated gypsum levels between 70 and 85%. Additionally, fifteen locations displayed gypsum levels between 85 and 95%. Concurrently, forty-eight locations exhibited gypsum levels between 50 and 95%.
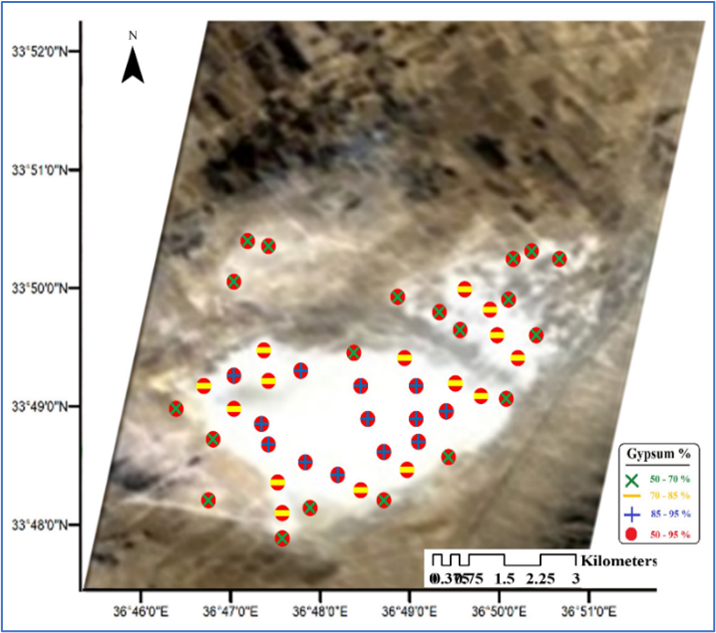
Figure 14. Locations of Field Points Signed on the Space Image in Jayroud Region
Static indicators were employed for the assessment of model performance in the estimation of gypsum by equations (Dodge, 2008), including the calculation of accuracy metrics such as the root-mean-square error (RMSE) and the determination coefficient (R2).
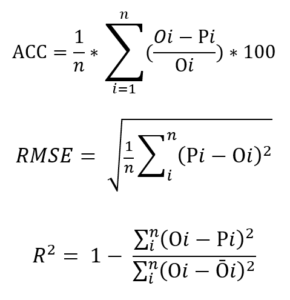
[where: (acc) is the accuracy assessment, (n) is number of samples, O and P are the observed/ recorded and predicted gypsum percent, respectively, for field i up to n].
Figure 15 depicts the static indicators’ results of the model performance, which estimate the gypsum percent and spread using a hyperspectral image in the Jayroud region.
The accuracy assessment value of the model performance is -11.5, indicating that the predicted gypsum percent is less than the observed value by approximately 11.5%. The root mean square error (RMSE) was found to be 10.25, and the coefficient of determination (R²) was 0.8 for gypsum percent 50-70%, 0.73 for 70-85%, 0.72 for 85-95%, and 0.94 for gypsum percent more 50%. These results indicate a significant confidence in the model’s ability to map and estimate gypsum, particularly within a wide range of gypsum presence. This is a more precise and accurate determination than that of Chatrenor et al. (2020) and Milewski et al. (2019).
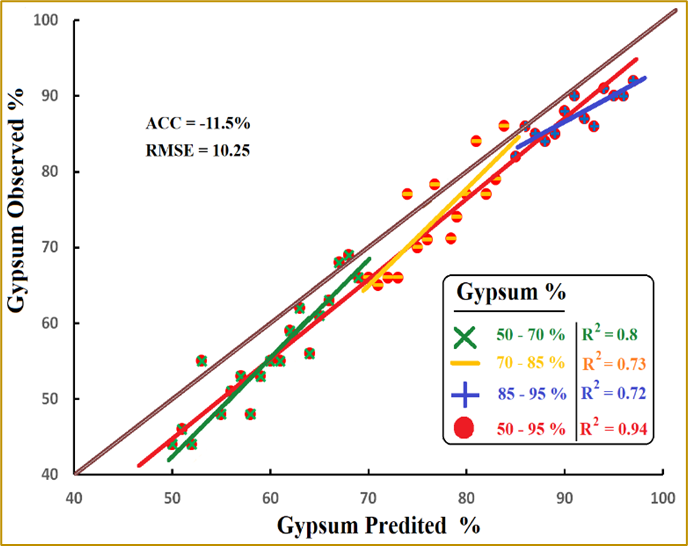
Figure 15. Static Indicators Diagram for Performance the Estimation Gypsum Model Using Hyperspectral Image in Jayroud Region.
The model of mapping gypsum using spectral libraries and the SAM technique on hyperspectral images demonstrated a high degree of accuracy when compared with field observations. The aforementioned advantages can be optimized through the use of an unmanned aerial vehicle (UAV) for periodic monitoring and high-spatial resolution. Additionally, the application of machine learning (ML) and artificial intelligence (AI) methods in data processing enables the extraction of information from large hyperspectral data sets. Periodic mapping and high quantifying facilitate optimal investment planning and effective sustainable management of resources.
N.T.I: Conceptualization, Methodology, Software, Validation, Investigation, Resources, Data curation, Writing of the original draft, Writing – review & editing.
The authors declare that they have no known competing financial interests or personal relationships that could have appeared to influence the work reported in this paper.
This research did not receive any specific grant from funding agencies in the public, commercial, or not-for-profit sectors.
No generative AI or AI-assisted technologies were used in the preparation of this manuscript.
The data that support the findings of this study are available from the corresponding author upon reasonable request.
The authors declare that there is no acknowledgement to be made.
This study did not involve human participants or animals; hence, no ethical approval was required.
Cite: Ibrahem, N. T. (2024). Hyperspectral Images Technique in Mapping and Quantifying Gypsum Case Study: Jayroud District. Steps For Civil, Constructions and Environmental Engineering, 2(1), 22–34. https://doi.org/10.61706/sccee1201123
![]() Copyright: © 2024 by the authors. Licensee Scientific Steps International Publishing Services, Dubai, UAE.
Copyright: © 2024 by the authors. Licensee Scientific Steps International Publishing Services, Dubai, UAE.
This article is an open access article distributed under the terms and conditions of the Creative Commons Attribution (CC BY) license (https://creativecommons.org/licenses/by/4.0/).


An independent academic publisher with an editorial team including many of the top researchers in the world. SSG publishes research, review, and case report articles in double-blind, peer-reviewed, open access scientific and academic journals.
Copyright © 2025 Scientific Steps International Publishing Services LLC (Dubai – United Arab Emirates)