
ISSN: 3005-8198 (online) | 3005-818X (print)
Volume 3, Issue 2 (April - June 2025) Pages 14-24
1 Faculty of Civil and Architectural Engineering, University of Kalamoon, Deir Atiyah, Syria.
2 Faculty of Civil Engineering, Homs University, Homs, Syria.
Precise control of internal voids within Hot Mix Asphalt (HMA) mixtures is imperative to ensure long-term pavement durability, resistance to environmental aging, adequate workability during placement, and fatigue performance under repeated loading. These internal air spaces represent a pivotal consideration in the design of asphalt mixtures, as they exert a direct influence on the mechanical behavior and service life of the mixture. Among the most critical volumetric indicators used to evaluate these aspects is the Voids in Mineral Aggregate (VMA), a fundamental design parameter in HMA specifications. Conventional approaches to determining VMA, particularly those reliant upon Marshall mix design procedures, necessitate extensive laboratory testing, the expertise of trained personnel, and a considerable investment of time. In order to address these limitations, this study explores the application of an automated photogrammetric technique based on computer vision, using low-cost mobile phone imagery, to estimate VMA in HMA specimens. The specimens were prepared in accordance with the Marshall method, and VMA values were ascertained through the implementation of both standard laboratory protocols and the proposed image-based approach. The photogrammetric workflow entailed the capture and processing of high-resolution images to facilitate the reconstruction of accurate vertical and horizontal cross-sections. A comparative analysis revealed minimal discrepancy between the two methods, suggesting that the proposed approach provides a reliable, efficient, and cost-effective alternative for VMA estimation and asphalt mixture evaluation.
Keywords: Smartphone Photography Voids in Mineral Aggregate, Image-Based VMA Estimation, Marshall Mix Design.
Asphalt pavements are predominantly composed of Hot Mix Asphalt (HMA), a material consisting of mineral aggregates bound together by asphalt cement, with void spaces interspersed throughout the mixture. The structural integrity of the pavement is achieved through the interlocking of coarse aggregates, while the asphalt binder fills the voids and ensures cohesion among the particles. Key volumetric properties of HMA, such as air voids, voids filled with asphalt (VFA), and voids in mineral aggregate (VMA), serve as quantifiable parameters reflecting the physical and mechanical characteristics of the asphalt mixture. These volumetric properties are critical indicators for assessing the overall performance of HMA and are commonly presented as fundamental criteria within material specifications (Guo et al., 2022; Tušar et al., 2022). A comprehensive understanding and visualization of these properties are imperative for evaluating the internal composition of HMA and predicting its field performance.
The performance and longevity of HMA mixtures are influenced by several factors, with aggregate properties and their proportions in the mixture being of paramount importance (Putra Jaya et al., 2014). It is widely accepted that the service life of HMA depends largely on appropriate aggregate gradation and skeletal structure. Aggregates, which include mineral filler, fine, and coarse aggregates, account for over 95% of the total HMA mass. This underscores their dominant role in mixture behavior (H. Liu et al., 2017). Ensuring optimal volumetric properties within HMA mixtures is crucial to achieving a balance between durability, workability, and resistance to common distress mechanisms such as rutting and fatigue (S. Liu et al., 2021). Due to its excellent mechanical and functional properties, HMA is extensively used in road construction and maintenance worldwide (Al Adday, 2020b; Al-Bayati et al., 2018).
Among the volumetric parameters, the voids in mineral aggregate (VMA) are of particular significance in HMA design, as they govern the mixture’s durability and rut resistance. The VMA has been demonstrated to influence the air void content, asphalt film thickness, and consequently, the long-term performance and resistance to aging of asphalt pavements. While VMA is a fundamental design parameter, it also plays an important role in construction quality control and post-construction evaluation. Deviations from target VMA values can lead to performance deficiencies and prompt remedial actions (AASHTO R 35-17, 2017; ASTM D3203-22, 2022). Standards such as AASHTO R35 and ASTM D3203 explicitly incorporate VMA as both a design criterion and a quality assurance measure, reflecting its multi-dimensional role throughout the pavement lifecycle.
In addition to volumetric considerations, the aggregate skeleton within HMA, which is directly related to VMA, influences critical performance parameters including workability, permeability, resistance to cracking and rutting, and overall durability (Al Adday, 2020a, 2020b; Pouranian & Haddock, 2018). The specification of minimum VMA values is a common practice in the industry, with the primary objective being to ensure an adequate asphalt binder content within the mix. This practice is undertaken to guarantee the longevity and structural integrity of the mix. Research findings indicate that the minimum VMA requirement is predominantly associated with the minimum asphalt film thickness, rather than the minimum binder content alone. Insufficient VMA can result in dense, thin, and brittle mixtures that are prone to premature failure, whereas excessive VMA can yield thick, durable mixes but may cause stability problems and increase costs (Al Adday, 2018; Sengoz & Topal, 2007; Singh et al., 2022).
A variety of standardized methods exist for determining VMA beyond the Marshall method. For instance, the German “Rigden Voids” method estimates effective voids in fine fillers, while the British Standard EN 12697-8 calculates voids in coarse aggregates using cylindrical specimens and bulk density measurements. These techniques primarily rely on physical measurements rather than image-based analyses.
Conventional laboratory determination of VMA entails meticulous experimental setups and the expertise of skilled technicians, resulting in laborious and time-consuming procedures. Despite their accuracy, conventional methods are limited in terms of throughput and the ability to perform rapid evaluation. This has prompted research into innovative, efficient alternatives for volumetric analysis. Recent advancements in computer vision and imaging tools have rendered digital image processing (DIP) and photogrammetry as efficient methods for estimating voids in mineral aggregates. As demonstrated by Obaidat et al. (1998, 2017), these techniques enable cost-effective and precise analysis of internal asphalt mix structures.
DIP techniques facilitate meticulous examination of HMA microstructure by assessing the spatial distribution of coarse aggregates and voids within cross-sectional images. When integrated with computer-aided design (CAD) software, these methods facilitate precise geometric measurements and volumetric calculations. The present study utilizes a multi-phase experimental approach, employing Marshall specimens to compare VMA results obtained from traditional laboratory methods with those derived via photogrammetric analysis and CAD-based quantification. This approach is supported by rigorous statistical evaluation using Student’s t-tests within SPSS software, confirming the validity and reliability of the photogrammetric method relative to the conventional standard (Forbes et al., 2010; Gladkoff et al., 2023).
Image J software plays a crucial role in the photogrammetric analysis by enabling detailed image processing, thresholding, and calibration. These processes are necessary to convert pixel-based measurements into real-world units with high precision. The software facilitates concurrent processing of numerous images and furnishes indispensable instruments for the measurement of dimensions and angles. Its applications are extensive, encompassing scientific research, including material characterization (Samadi, 2024).
Conventional approaches for estimating VMA are frequently characterized by their labor-intensiveness and time-consuming nature, necessitating the expertise of skilled technicians to execute precise measurements. These limitations impede the capacity for expeditious evaluation and extensive implementation in quality control procedures. To address these challenges, the present study proposes an image-based approach that utilizes digital image processing and photogrammetry techniques. This method offers a more efficient, accurate, and cost-effective alternative for VMA determination, enabling faster evaluation while maintaining reliability. The proposed methodology is a multifaceted approach that integrates longitudinal and cross-sectional analyses with rigorous statistical validation. This comprehensive framework aims to address the existing gaps in conventional VMA estimation and introduce a novel pathway for improving asphalt mix design and performance assessment.
The research was methodically divided into four primary stages to systematically investigate the volumetric properties of asphalt mixtures.
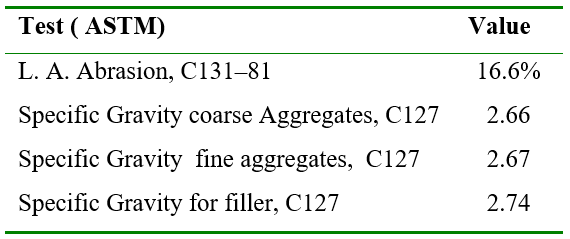
A series of laboratory tests were conducted on aggregate samples to ascertain their physical and mechanical characteristics. The suite of tests included sieve analysis, specific gravity measurement, and the Los Angeles abrasion test. The aggregates utilized in this study were obtained from limestone quarries located in Hasya town, which is situated in the southern countryside of Homs, Syria. The results of these tests are summarized in Tables 1 and 2.
Table 1. Aggregate Gradation (ASTM, C131)
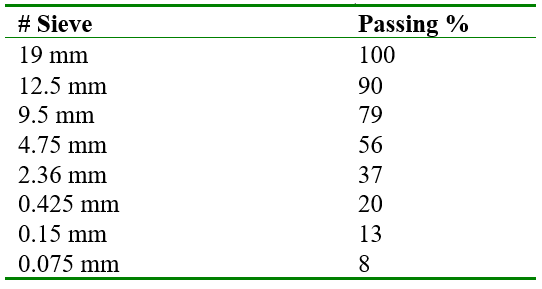
Table 2. Properties of Aggregates
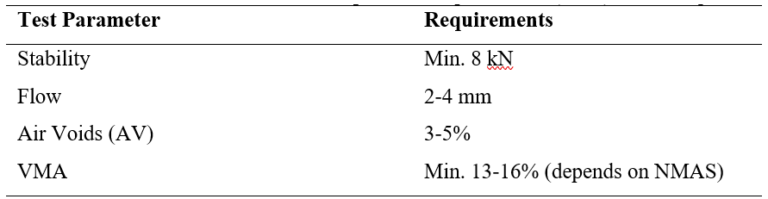
Experiments were conducted on asphalt mixture samples prepared according to the Marshall method. For each asphalt content level—ranging from 4.5% to 7.5%—three replicates were meticulously prepared. This stage entailed the calculation of the Voids in Mineral Aggregate (VMA). The Marshall specimens were fabricated under controlled laboratory conditions in compliance with the standardized Marshall Test (ASTM D 1559-76, n.d.). The procedure was initiated with the heating of mineral aggregates to a temperature range of 160–170°C and asphalt binder to 145–150°C to ensure optimal viscosity for mixing. These components were then subjected to a thermal conditioning process, followed by a mechanical blending procedure in a preheated mixing vessel. This was done to achieve a uniform asphalt-aggregate composite. The resultant mixture was subsequently transferred into cylindrical molds with an internal diameter of 101.6 millimeters and a height of 63.5 millimeters. The compaction process was executed through the utilization of a Marshall impact compactor, which administered a total of 75 standardized blows per surface. The execution of this compaction protocol was carried out under conditions of elevated temperature, thereby simulating the field placement conditions. Subsequent to the compaction process, the specimens were subjected to a 24-hour curing period at ambient temperature prior to extraction from the molds. As illustrated in Table 3, the fundamental standards for Marshall testing are delineated.
Table 3. The Marshall Standards parameters [AASHTO (2022) standards]
The optimal asphalt content is determined by the fulfillment of three fundamental criteria: maximum Marshall stability, peak bulk specific gravity, and 3-5% air voids. The optimum value is defined as the intersection point that satisfies all specifications. The values in question are illustrated in the Figure by means of arrows.
The calculation of VMA was performed using a computer-aided design (CAD) program. Cylindrical specimens were meticulously bisected both longitudinally and transversely into two sections by means of a stone cutting machine equipped with a water spray system to cool the specimen and prevent surface deformation caused by frictional heat (Figure 1). A visual inspection of the aggregate particles revealed that they were randomly oriented within the asphalt concrete mixture. Larger areas of the particles were observed in horizontal cross-sections compared to vertical ones. This discrepancy was considered to be of significance, as it directly impacts the variability in mixture properties.
To quantitatively assess these differences, a statistical analysis was conducted using the SPSS software. The VMA ratios for the longitudinal and transverse sections were then compared to provide a comprehensive evaluation of the variance in mixture characteristics.
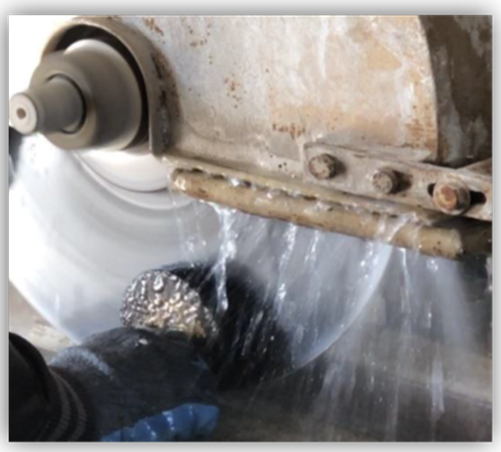
Figure 1. Stone Cutting Machine
To ensure maximum precision during image analysis, a measurement grid consisting of squares measuring 12 centimeters per side was meticulously delineated on A0 paper (Figure 2). Cross-sections were positioned within this grid to standardize imaging. The cross-sections were imaged using an iPhone 8 Plus camera, with meticulous attention to maintaining the camera’s optical axis perpendicular to the sample surface to minimize distortion.
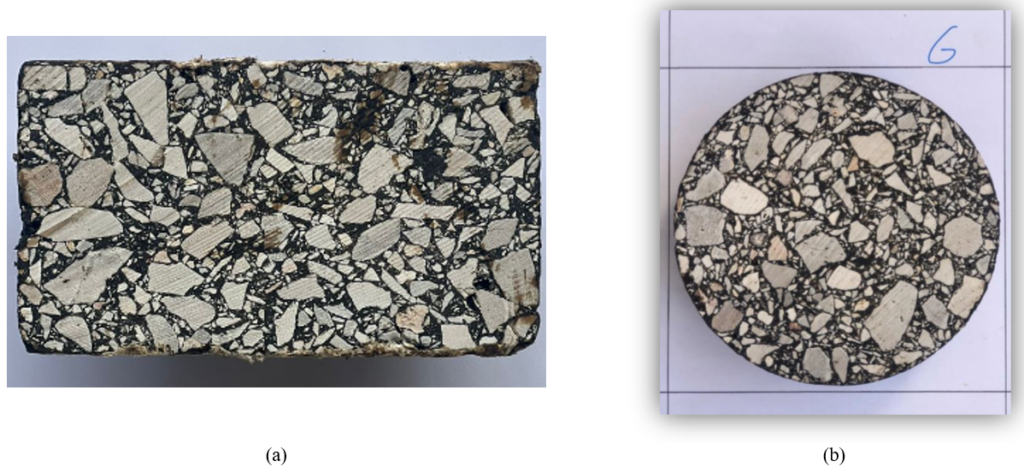
Figure 2. Cross-Sections Arranged within a 12 cm × 12 cm Measurement Grid.
(a) Vertical Sections Positioned in the Grid Squares.
(b) Cross-Sections Aligned within the Standardized Grid.
The captured images were imported into an AutoCAD file for further analysis. In order to enhance the clarity of aggregate boundaries and facilitate digital outlining, adjustments were made to the image contrast and transparency parameters. The transparency parameter was set at 50% in order to optimize the visibility of the aggregate boundaries. The SCALE command was utilized to calibrate the images relative to the dimensions of the actual specimen, with the 12-centimeter square side designated as the scale length. The tracing of aggregate shapes was facilitated by the utilization of the POLYLINE tool, a function that enables the generation of continuous closed shapes within a single plane. These shapes were subsequently delineated through the utilization of the HATCH function, thereby enabling the calculation of their respective areas. Figure 3 presents the cross- and longitudinal-sections of the Marshall samples that have been entered into AutoCAD.
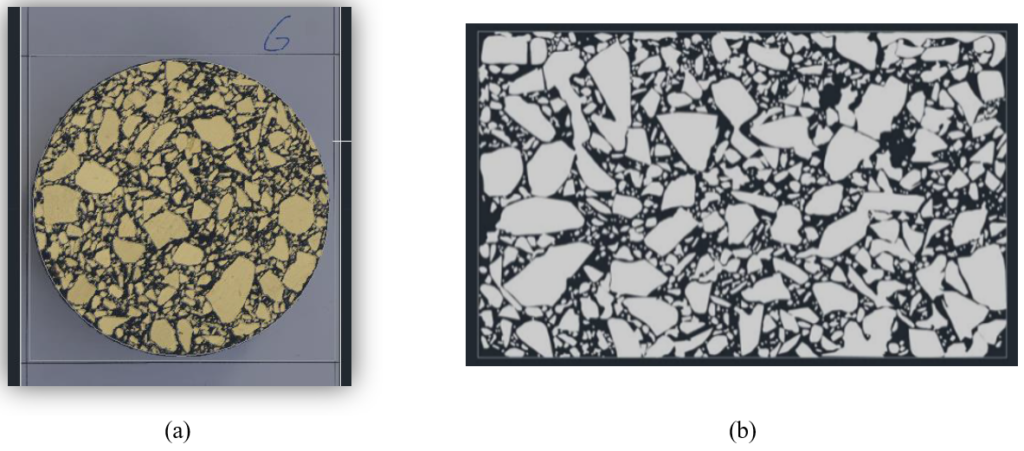
Figure 3. Cross- and longitudinal-Sections of Marshall Specimens Processed in AutoCAD.
(a) Cross-Sections Traced and Outlined.
(b) Vertical Sections of Specimens with Delineated Boundaries.
The total area of the aggregates was obtained from the Properties function corresponding to the hatched regions. The VMA was subsequently calculated using the following equation:
Where: A, Total Area of Horizontal or vertical Section, B: Area of Aggregates
The application of automated photogrammetric techniques using Image J software was employed to analyze the samples and estimate the VMA. A total of 55 Marshall samples were examined, including 21 samples used for VMA calculation via the conventional laboratory method and 34 samples prepared with 7% optimum asphalt content (comprising 16 cross sections and 18 longitudinal sections).
This methodology was subsequently replicated with a different cellular phone featuring a higher camera resolution. The iPhone 14 Pro Max was selected for this experiment, with particular emphasis on ensuring the accuracy of the vertical angle of the shot above the sample and its midpoint, maintaining the optical axis perpendicular to the sample surface.
In this study, the software was employed for precise analysis of bituminous mixtures and detailed examination of coarse aggregate grain shapes. Following the capture of images of all specimens, each sample image was imported into ImageJ for the purpose of calculating the percentage of voids. Figure 4 displays the longitudinal and cross-sections of the Marshall specimen that were imported into ImageJ.
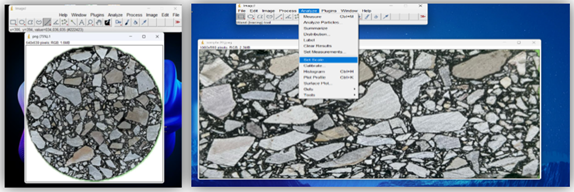
Figure 4. Cross-Sections and Vertical of Specimens by Image J Pro
To facilitate accurate dimension determination and area analysis of gravel grains, image transparency and color contrast were adjusted accordingly. The calibration of the images was performed to convert pixel dimensions into real-world units, with centimeters serving as the measurement unit. A line representing the known sample diameter of 10 centimeters was drawn, enabling the calibration process.
Subsequently, a circular frame was delineated around each sample to isolate it from the background in the image. This ensured that the background was excluded from the analysis and improved the reliability of area measurements. Subsequently, the total area of each sample was measured.
Subsequently, the images were converted to 8-bit grayscale format. In such images, there are 256 intensity levels (2^8), where a pixel intensity of 0 corresponds to black, 255 to white, and intermediate values represent varying shades of gray.
The thresholding process was a critical step in distinguishing pixels within the desired density gradient range from those outside it. Subsequent to thresholding, the software calculated the aggregate area by identifying and quantifying all white regions in the image. Furthermore, ImageJ furnished a thorough enumeration by labeling each aggregate piece directly on the image, facilitating additional verification and analysis. The research methodology is illustrated in Figure 5.
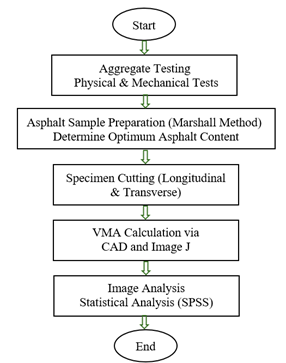
Figure 5. Flowchart of Research Methodology
Prior to the implementation of automated photogrammetric techniques for the estimation of the VMA ratio of HMA specimens, it is imperative to first calculate the main parameters of Marshall samples using the conventional laboratory method. The maximum recorded stability, as depicted in Figure 6, was determined to be 800 kilograms, corresponding to an asphalt content of 6%. This value falls within the acceptable range for bituminous mix design, which has a standard limit of 816 kg. Figure 7 demonstrates a substantial variation in specific gravity subsequent to the incorporation of 6.25% asphalt content. The relationship between air voids and asphalt content is depicted in Figure 8, which reveals a clear trend of decreasing air voids with increasing asphalt content. The asphalt content corresponding to 4% air voids is identified as 5%. The mean of these three values was calculated, and the result indicated an asphalt content of 5.75%. A discernible trend emerges from the data, indicating a systematic decrease in air voids as the asphalt ratio increases. As illustrated in Figure 9, a positive correlation exists between VMA and the percentage of asphalt.
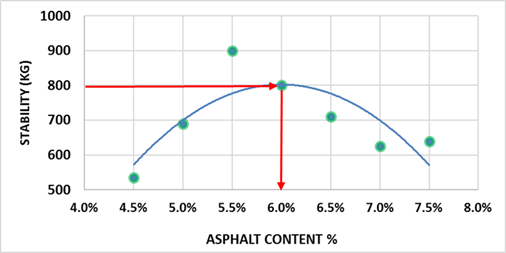
Figure 6. Marshall Stability Versus Asphalt Content
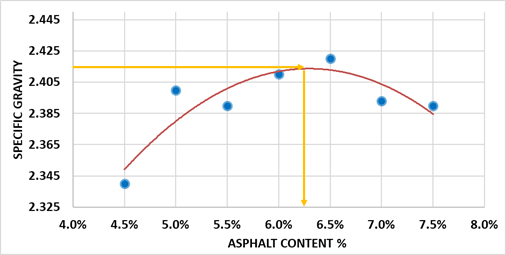
Figure 7. Variation of Specific Gravity with Asphalt Content
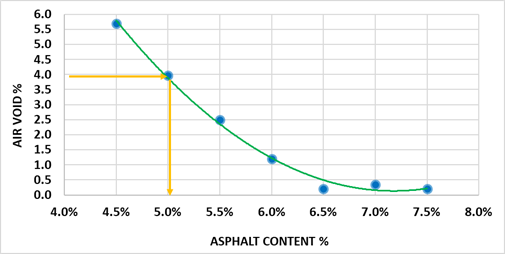
Figure 8. Relationship Between Air Voids and Asphalt Content
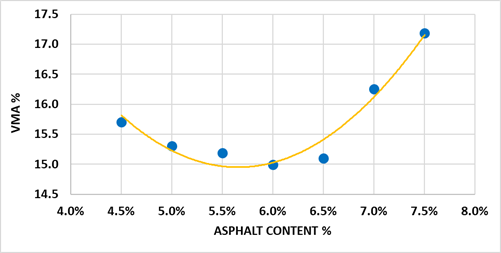
Figure 9. Variation of VMA with Asphalt Content
The VMA is widely regarded as a primary indicator of enhanced asphalt durability; therefore, it is essential to maintain this percentage at a minimum. The figure indicates that the lowest recorded value for VMA% is 5.5%. The optimal asphalt content is determined to be 6% by weight of the sample, as determined by maximum specific gravity and stability, and a reasonable void ratio of 4%. This is the value that will be prepared for 34 asphalt samples to calculate VMA using Image J Pro. Following the conventional theoretical approach, the VMA diagram was initially delineated. Subsequently, the VMA was computed with the assistance of AutoCAD and Image J Pro. As illustrated in Figure 10, the VMA values calculated using AutoCAD and Image J Pro demonstrate a certain degree of proximity to the traditional theoretical values, though they do not precisely align. It is noteworthy that VMA offers the most advantageous value among the three methods when the asphalt content is set at 7%. It is noteworthy that the curves of the Image J and AutoCAD methods intersect at 7.25%. As stated in the works of Obaidat et al. (1998, 2017), a slight discrepancy was identified between the theoretical and visualised values. This discrepancy is consistent with the findings of the current study. Figure 10 has been assigned according to the revised version. The 7.25% convergence observed in Figure 9 indicates a heightened sensitivity of digital methods to variations in binder film at median asphalt contents (5-6.5%), which does not correspond to the altered optimum. The performance-based optimum remains at 6% AC, as validated by maximum stability (900 kg), target air voids (4%), and peak specific gravity (2.42). Conventional methods are more effective in capturing the extremes of void distribution (low/high AC), thereby reflecting measurement variance rather than performance shift.
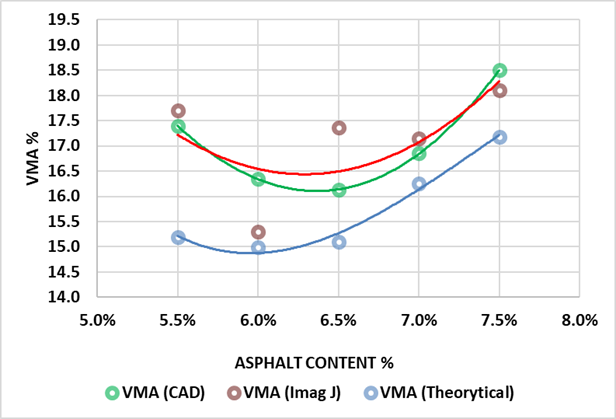
Figure 10. Comparison of VMA Values Obtained by Theoretical, AutoCAD, and Image J Pro Methods
The present investigation focuses on the issue of image resolution dependency. The accuracy of VMA estimation when employing both AutoCAD and ImageJ methods was found to be significantly influenced by the resolution and quality of mobile phone cameras. A growing body of research has demonstrated that lower-end cameras frequently result in images exhibiting elevated levels of image distortion. This phenomenon has a deleterious effect on the clarity of aggregate boundaries, which consequently leads to greater variability in area calculation. Deviation from Theoretical Values: In certain instances, the VMA results derived from imaging methodologies exhibited discrepancies that exceeded acceptable limits (e.g., greater than ±0.05%) when compared to the results obtained in the laboratory. While the observed discrepancies were relatively minor, they underscore the necessity for further refinement of the methodology before it can be established as a reliable standard for testing.
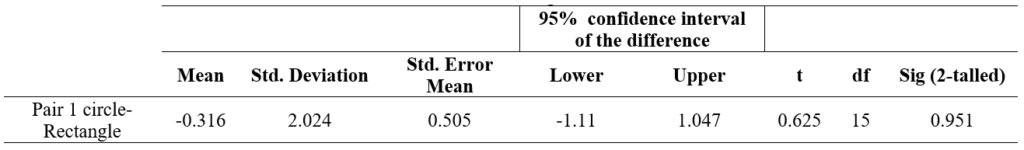
In order to evaluate the statistical significance between sample means, the student’s t-distribution was applied as a standard inferential method. The utilization of the SPSS program yielded no statistical discrepancy between random samples from 16 longitudinal segments of the Marshall sample and random samples from 18 longitudinal segments. The t-distribution of the student will be utilized to ascertain whether the data suggests a substantial discrepancy between the two groups. A t distribution with a significant value will reject the hypothesis if the t value is smaller than 0.5, indicating that the means were significantly different. A comparison is made between the VMA calculations derived from both longitudinal and sectional sections. In this research, the T-value was 0.625, as shown in Table 4, which is greater than 0.5. Therefore, it is possible to combine the VMA-dependent data for longitudinal and transverse samples.
Table 4. t-Test Results for VMA% of Longitudinal and Transverse Sections
Therefore, it can be deduced that there is an absence of statistical evidence to indicate that there is a discrepancy in the VMA calculation between longitudinal and sectional sections. Consequently, the findings from the cross-sectional and longitudinal sections can be integrated into a unified model, as illustrated in Table 5. Subsequent to this, the VMA values can be entered into the SPSS to generate a plot of the normal distribution, as demonstrated in Figure 11.
Table 5. Combined VMA% Values for Longitudinal and Transverse Sections.
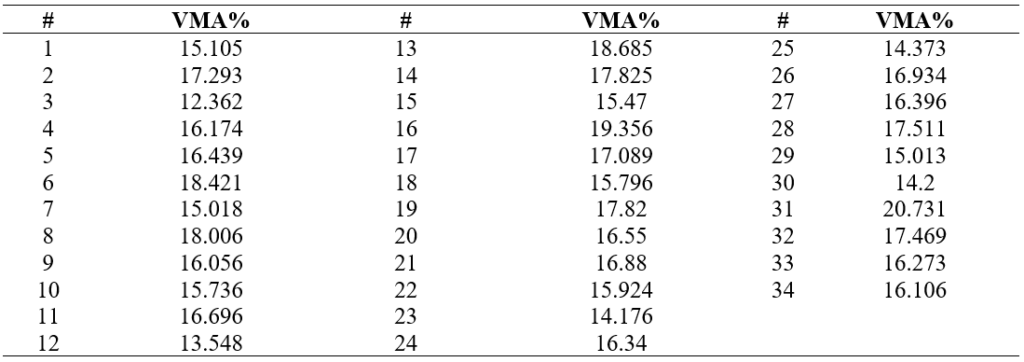
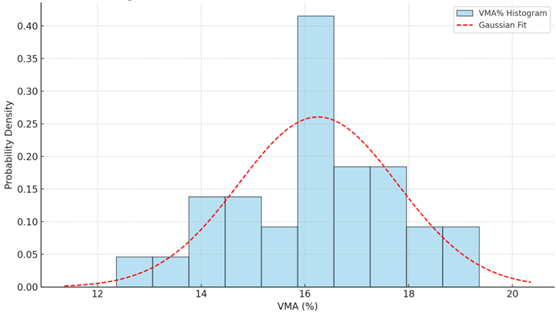
Figure 11. Normal Distribution “Gaussian Curve” for Longitudinal and Transverse Samples
The objective of the statistical analysis is to assess the normality of distribution and the absence of scatter in the VMA values for both the longitudinal and sectional sections. As illustrated in Figure 10, the statistical distribution of VMA values is derived from both longitudinal and transverse cross-sections of Marshall Specimens. The resulting histogram exhibits a high degree of alignment with a Gaussian (normal) distribution curve, indicating that the VMA values are symmetrically distributed around the mean, with no apparent skewness or outliers.
The calculated mean VMA value is approximately 16.3%, with a standard deviation of ±1.7%. This degree of variability is within the typical acceptable range for hot mix asphalt (HMA) volumetric properties, indicating that the calculated average VMA value falls within the recognized design limits for hot mix asphalt mixtures, which typically range between 10% and 22%, in accordance with standard specifications (Mallick & El-Korchi, 2018). The normal distribution and the distribution of values around the mean value in terms of the standard deviation. A review of the extant literature reveals that 95% of the gap percentage value falls within the range [µ-2 σ, µ+2 σ] (from 13 to 19.8) (Garber & Hoel, 2009). This strong conformity with a normal distribution serves to reinforce the statistical reliability and repeatability of the image-based method utilized in this study. Furthermore, it validates the efficacy of integrating longitudinal and cross-sectional data, as the dispersion remains consistent irrespective of the cutting direction. Moreover, the absence of heavy tails or multiple peaks suggests that the photogrammetric process (comprising imaging, calibration, and thresholding) did not introduce substantial systemic bias. Consequently, the method exhibits considerable promise for standardization in routine quality control, particularly in circumstances where resource constraints impede access to conventional laboratory procedures. A critical constraint pertains to the threshold selection process, which exerts a direct influence on the accuracy of void quantification. Inappropriate thresholding may lead to over- or underestimation of void areas due to misclassification of image regions. To address this, future research should consider the implementation of adaptive thresholding or advanced segmentation techniques, in conjunction with validation methods to ensure the robustness of the results and the minimization of uncertainty.
The study demonstrated the simplicity and accessibility of both cellular phones and ImageJ software. This methodology functions as a pragmatic intermediate solution, serving to bridge the limitations of manual testing procedures and the complexity of fully automated analytical systems. A meticulous examination of the study’s findings enables the formulation of the ensuing conclusions, which are deemed to be substantiated by the available evidence.
Despite the encouraging outcomes of the photogrammetric and image processing methodologies employed in this study, it is imperative to acknowledge several limitations. Contrast and Thresholding Challenges: Image segmentation and thresholding techniques in Image J are contingent on the grayscale contrast between aggregates and asphalt samples. It was determined that inconsistencies in lighting and surface reflectivity led to variations, particularly during the conversion of images to 8-bit grayscale. This variability has the potential to impact the consistency of void ratio measurements. A thorough investigation into the potential presence of a manual tracing error within a CAD method is deemed necessary. The AutoCAD-based method required the manual delineation of aggregate boundaries employing polylines. This introduces subjectivity and potential human error, particularly for smaller particles or poorly defined edges, leading to possible over- or underestimation of the aggregate area.
The findings of the present study suggest that the implementation of high-resolution cameras, in conjunction with artificial intelligence-driven segmentation algorithms, has the potential to enhance the acquisition of sample images and consequently refine the precision of VMA calculations. Another potential approach involves the use of automated multi-view stereo (MVS) imaging reconstruction to estimate the VMA of HMA samples.
F.A: was responsible for conceptualization, methodology, validation, formal analysis, investigation, resources, data curation, writing of the original draft, review and editing, visualization, supervision of the work, project administration and funding acquisition.
W.M: contributed to methodology, investigation, supervision and funding acquisition.
J.K: handled methodology, software, validation, formal analysis, investigation, resources, data curation, writing of the original draft and funding acquisition.
H.S: was involved in methodology, formal analysis, investigation, data curation and funding acquisition.
B.A: methodology, data curation, funding acquisition.
E.H: methodology, formal analysis, investigation, data curation and funding acquisition.
M.H.J: methodology, data curation, funding acquisition.
All authors read and approved the final version of the manuscript.
The authors declare that they have no known competing financial interests or personal relationships that could have appeared to influence the work reported in this paper.
This research did not receive any specific grant from funding agencies in the public, commercial, or not-for-profit sectors.
No generative AI or AI-assisted technologies were used in the preparation of this manuscript.
The data supporting the findings of this study are available from the corresponding author upon reasonable request.
The research team thanks University of Kalamoon for providing support in completing the laboratory experiments.
This study did not involve human participants or animals; hence, no ethical approval was required.
Cite: Aladday, F., Moussa, W., Khalil, J., Shamsini, H., Al Rfaaieh, B., Hafez, E., & Junaid, M. H. (2025). Digital Evaluation of Voids in Mineral Aggregate (VMA) in Asphalt Mixtures Using Photogrammetric and Image Processing Techniques. Steps For Civil, Constructions and Environmental Engineering, 3(2), 14-24. https://doi.org/10.61706/sccee12011164
![]() Copyright: © 2025 by the authors. Licensee Scientific Steps International Publishing Services, Dubai, UAE.
Copyright: © 2025 by the authors. Licensee Scientific Steps International Publishing Services, Dubai, UAE.
This article is an open access article distributed under the terms and conditions of the Creative Commons Attribution (CC BY) license (https://creativecommons.org/licenses/by/4.0/).


An independent academic publisher with an editorial team including many of the top researchers in the world. SSG publishes research, review, and case report articles in double-blind, peer-reviewed, open access scientific and academic journals.
Copyright © 2025 Scientific Steps International Publishing Services LLC (Dubai – United Arab Emirates)